")
")
")
")
")
")
")
")
")
")

Fundamental Analysis And Intrinsic Value of Vedanta Ltd.(2022-23)
Click Here For Fundamental Analysis And Intrinsic Value Of Vedanta Ltd. (2023-24)
Dated: 25 Mar 23
Company: Vedanta Ltd.
CMP: Rs. 269.75
Introduction
In this article we will try to analyze Vedanta Ltd. Based on previous six years of financial statements viz Balance sheet, Profit and Loss statement and Cash flow statement. With this analysis we will try to gain insight into the financial health, operating efficiency and profitability of the company and finally try to derive the intrinsic value of the stock using Discounted Cash Flow method and the price at which the stock becomes attractive for long term investment.
Note: Here we are carrying out only the quantitative fundamental analysis of the company as the qualitative analysis is more subjective and individual views may vary vastly.
Leverage Ratios
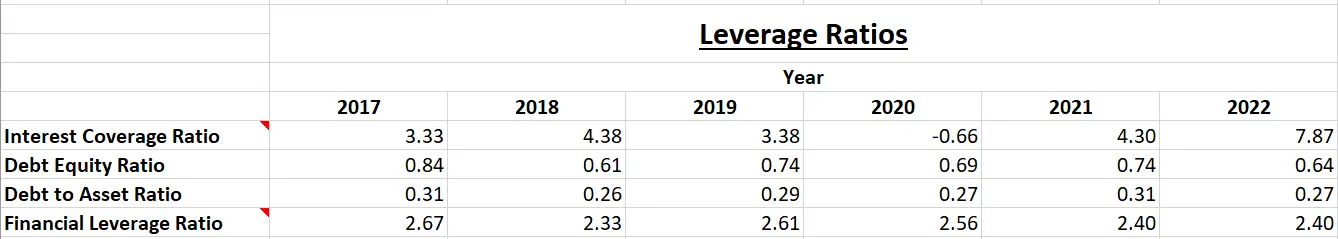
Observations:
- With exception of 2020 the interest coverage ratio of the company looks very healthy.
- All other ratios are indicative of slight reduction in reliance on debt.
- Financial leverage ratio also indicates steady increase in shareholders equity. The company is operating with almost no debt and that is a healthy sign for the financial health of the company.
Operating Ratios
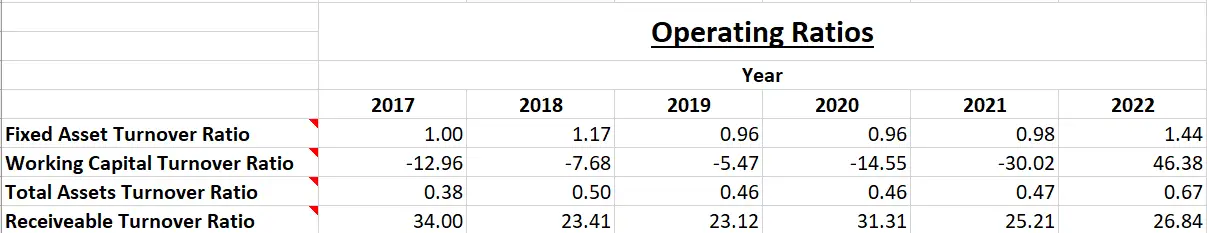
Observations:
- The company has been operating with negative working capital historically except for 2022 where situation has improved. Deeper analysis shows that the company relies on short term borrowings to meet its requirements and it contributes a great deal towards its current liabilities. Though the company has been able to manage with negative working capital all these years but it is not considered a good sign.
- All other ratios have shown slight improvement during the period under consideration.
Profitability Ratios
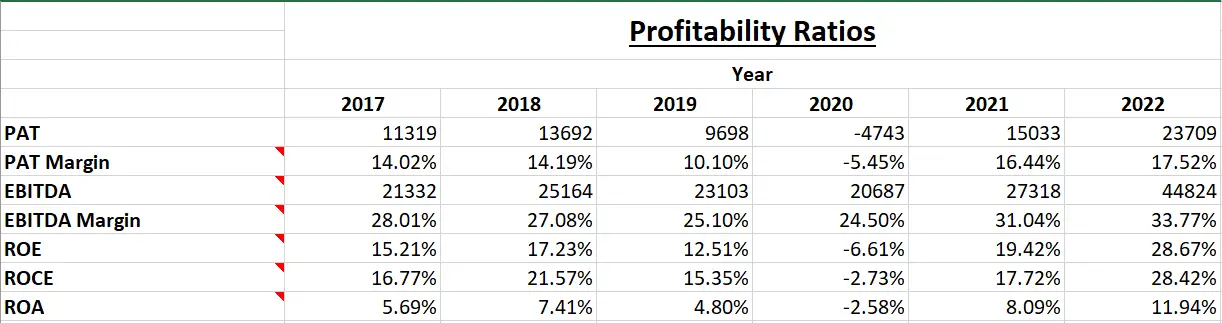
Observations:
- With exception to 2020 the PAT and EBITDA have shown improvement. Also the margins have improved over the years.
- All other ratios have shown improvement during this period with exception to 2020.
Intrinsic Value
Assumptions:
- The increase in cash flow is assumed to be Rs. 404.64 Crores for the first five years and then Rs 202.32 Crores from sixth to tenth year. The growth rate is projected based on the past Free Cash Flows (refer to figure below). In the past free cash flow has increased at the rate of Rs. 809.28 Crores per year, however, with a conservative outlook we have taken 50% of that figure for the first five years and 25% of that for the next five years.
- Terminal growth rate is assumed to be 0%.
- Discount rate is assumed to be 12%.
- Free Cash Flow is extrapolated with the base value as Rs 11000 Crores which is average of the two years viz 2018 and 2020 when we saw the dip in free cash flows. The average of free cash flows for the previous years is Rs. 15000 Crores.
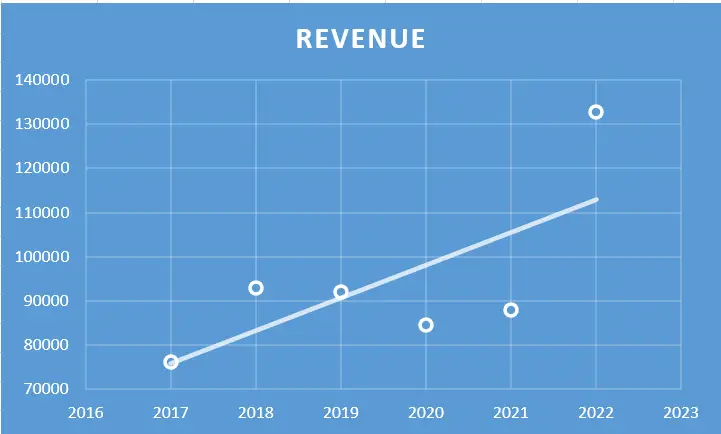
- Increase in Revenue is assumed to be Rs.3101.17 Crores per year for the first five years and then Rs 1550.58 Crores per year for the next five years. This growth rate is based on linear regression analysis of previous year’s revenues (refer to figure below). In the past revenue has increased at the rate of Rs. 6202.33 Crores per year, however, with a conservative outlook we have taken 50% of that figure for the first five years and 25% of that for the next five years.

- Free cash flow will be 16% of revenues in future. The FCF/Revenue ratio for the period under consideration has an average of 0.16. Here we assume that the same average will hold good for future.
Based on the above assumptions we have arrived at two levels as intrinsic value of the firm. One is based on extrapolation of Free cash flows and the other is based on Free cash flows derived from extrapolated values of revenues. Both the methods only differ in how the input values are derived; in both the cases the present value is arrived at using Discounted Cash Flow Method.
Revenue Growth Model
Intrinsic Value: Rs. 464.66
Stock Entry price with 25% margin of safety: Rs.348.49
Free Cash Flow Growth Model
Intrinsic Value: Rs.293.62
Stock Entry price with 25% margin of safety: Rs.220.21
The average of the above two stock entry prices works out to be Rs.284.35. When the stock starts trading below this price it becomes attractive for long term investment.
Author
Jibu Dharmapalan
Fundamental Analyst
If You Like This Content 👇👇👇
Click Here To Join Us on Telegram For Free Live Interactive Discussion And Learning
Disclaimer: This is not a stock advise. Investors must use their due diligence before buy/selling any stocks.
References:
https://www.nseindia.com/get-quotes/equity?symbol=VEDL
https://www.vedantalimited.com/eng/investor-relations-overview.php#resultsReports
More about the Company:
Board Of Directors
Click Here to go to Home Page


")
")
")
(Modified)")
")
")