")
")
")
")
")
")
")
")
")
")
Fundamental Analysis And Intrinsic Value of Uflex Ltd.
Dated: 05 Apr 23
Company: Uflex Ltd.
CMP: Rs. 361.15
Introduction
In this article we will try to analyze Uflex Ltd. based on previous six years of financial statements viz Balance sheet, Profit and Loss statement and Cash flow statement. With this analysis we will try to gain insight into the financial health, operating efficiency and profitability of the company and finally try to derive the intrinsic value of the stock using Discounted Cash Flow method and the price at which the stock becomes attractive for long term investment.
Note: Here we are carrying out only the quantitative fundamental analysis of the company as the qualitative analysis is more subjective and individual views may vary vastly.
Leverage Ratios
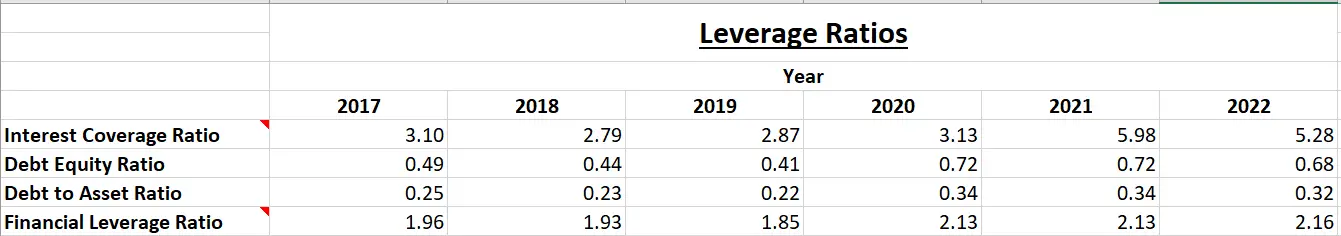
Observations:
- The debt on the company has increased during the period. However it is attributed to major expenditure on Capex as a part of expansion of existing facilities and further expansion into new regions globally.
- Despite the added debt the company has maintained a good interest coverage ratio.
Operating Ratios
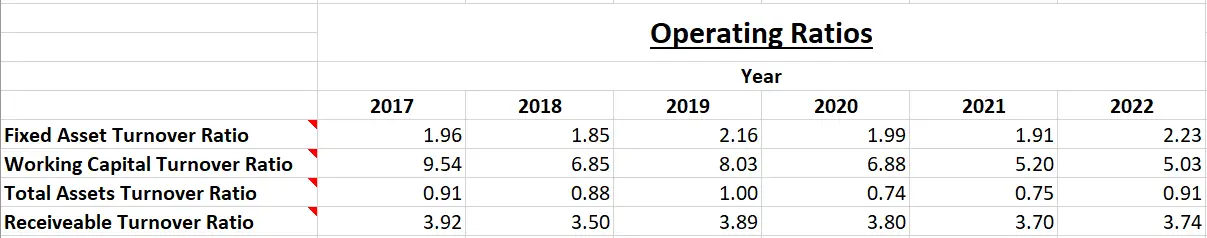
Observations:
- Working capital turnover ratio has declined over the period. Company has to focus on efficient use of working capital.
Profitability Ratios
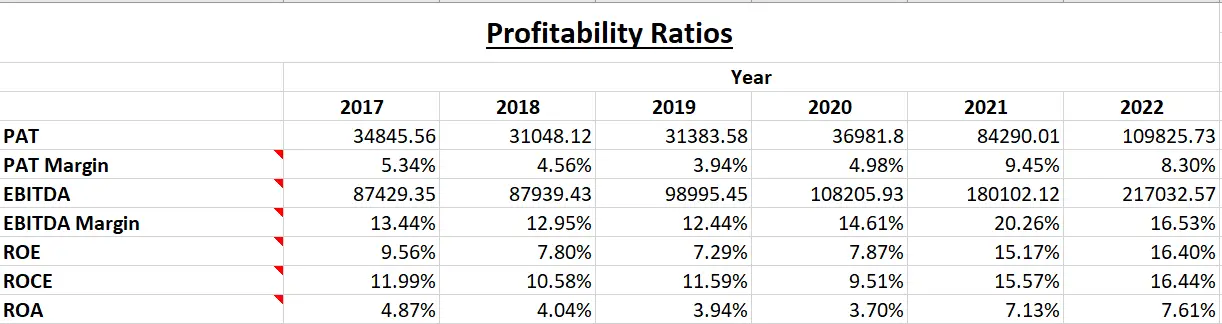
Observations:
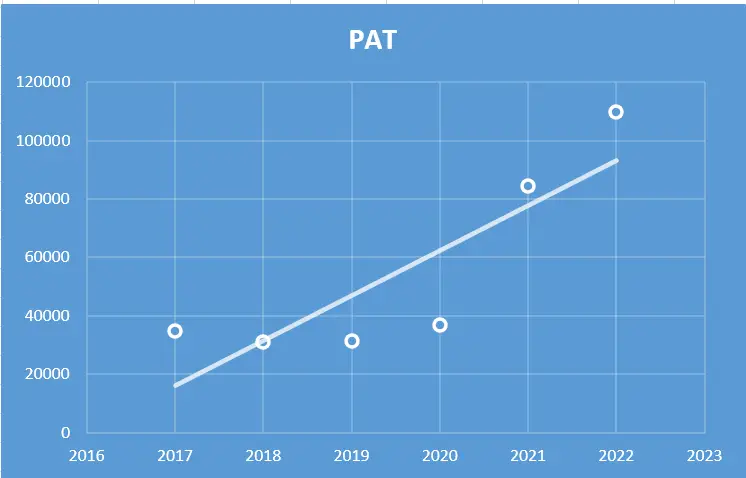
- It is noteworthy that EBITDA and PAT margins have improved during the period as EBITDA and PAT grew respectively.
- All other ratios also have shown improvement during the period.
Intrinsic Value
Assumptions:
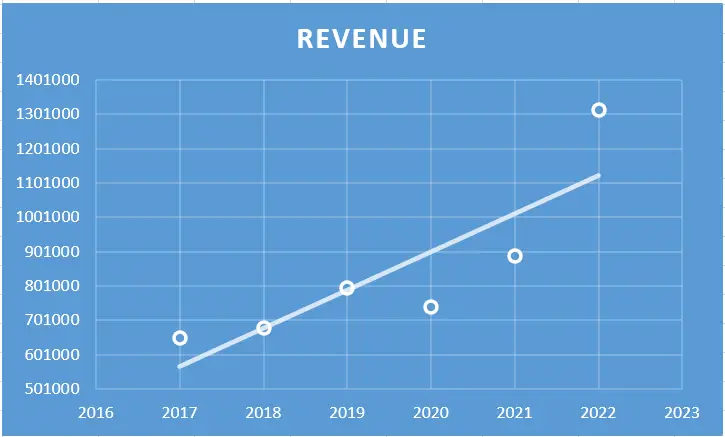
- The free cash flow during the period under observation has been on a downward trend, however this is because of major expenditure the company is incurring towards expansion of existing facilities and expansion into new regions globally. Further analysis shows that PAT and Revenue are showing continued growth during the same period. Therefore, for extrapolating the future free cash flows Revenue is taken as the basis.
- Terminal growth rate is assumed to be 0%.
- Discount rate is assumed to be 12%.
- Increase/(decrease) in Revenue is assumed to be Rs. 46262.40 Lacs per year for the first five years and then Rs 23131.20 Lacs per year for the next five years. This growth rate is based on analysis of previous year’s revenues (refer to figure below). In the past revenue has increased/(decreased) at the rate of Rs. 95524.80 Lacs per year, however, with a conservative outlook we have taken 50% of that figure for the first five years and 25% of that for the next five years.
- Free cash flow will be 3% of revenues in future. The FCF/Revenue ratio for the period under consideration (excluding year 2020) has an average of 0.01. Here we assume that the FCF/Revenue ratio will improve in coming years as the new facilities start production.
Based on the above assumptions we have arrived at intrinsic value of the firm based on Free cash flows derived from extrapolated values of revenues. The present value of future free cash flows is arrived at using Discounted Cash Flow Method.
Revenue Growth Model
Intrinsic Value: Rs.471.49
Stock Entry price with 25% margin of safety: Rs.353.61
The average of the above two stock entry prices works out to be Rs.353.61. When the stock starts trading below this price it becomes attractive for long term investment.
Author
Jibu Dharmapalan
Fundamental Analyst
Disclaimer: This is not a stock advise. Investors must use their due diligence before buy/selling any stocks.
References:
https://www.uflexltd.com/financials.php
https://www.bseindia.com/stock-share-price/uflex-ltd/uflex/500148/financials-annual-reports/
More about the Company:
Board Of Directors
Click Here to go to Home Page

")
")
")
")
")
")