")
")
")
")
")
")
")
")
")
")

Fundamental Analysis And Intrinsic Value of MRF Ltd.
Dated: 17 Jun 23
Company: MRF Ltd.
CMP: Rs. 99980.35
Introduction
In this article we will try to analyze MRF Ltd. based on previous six years of financial statements viz Balance sheet, Profit and Loss statement and Cash flow statement. With this analysis we will try to gain insight into the financial health, operating efficiency and profitability of the company and finally try to derive the intrinsic value of the stock using Discounted Cash Flow method and the price at which the stock becomes attractive for long term investment.
MRF Ltd. is an Indian multinational tyre manufacturing company. The company’s portfolio includes tyres for buses, trucks, cars, motorcycles and offroad vehicles. MRF tyres are known for their superior quality, performance and durability. The company carters for varied customer requirements and market segments. The company has strong presence in domestic market and exports to more than 60 countries worldwide. Apart from tyres the company has also diversified into other rubber products, paints, toys, conveyer belts and sports goods.
Note: Here we are carrying out only the quantitative fundamental analysis of the company as the qualitative analysis is more subjective and individual views may vary vastly.
Leverage Ratios
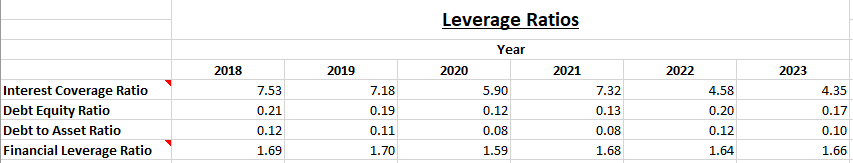
Observations:
- Company has very low debt and has maintained it at such levels during the period under observation.
- Interest coverage ratio has declined mainly because PAT has been declining during this time frame.
Operating Ratios
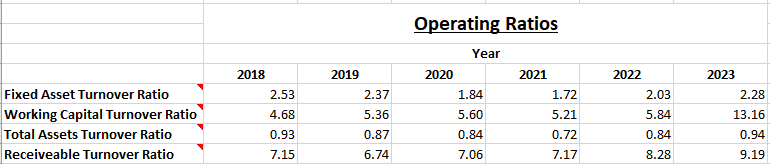
Observations:
- Receivables have not proportionately increased with revenue which is good.
Profitability Ratios
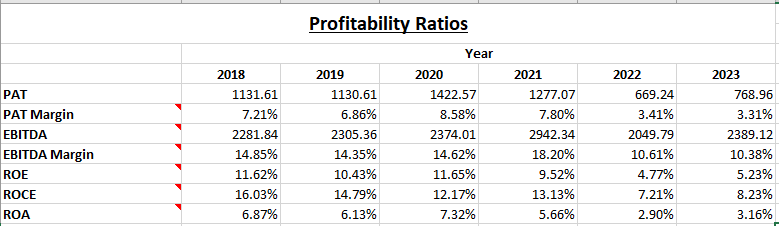
Observations:
- PAT, PAT margin and EBITDA margins have been on a decline. This indicates the competition faced by the company. It is forced to take a hit on its profit margins to retain market share.
- All other ratios ROE, ROCE and ROA are showing decline. This indicates that the company’s leadership position is being challenged by competitors and thus the overall profitability of the company is on a downward trend.
Intrinsic Value
Assumptions:
There were multiple occurrences of negative free cash flow during the period under observation. This is due to heavy capex incurred by the company during the period under observation. Here we have relied on revenue growth and shareholder’s equity growth to figure out the expected free cash flow for future and thus the intrinsic value of the company.
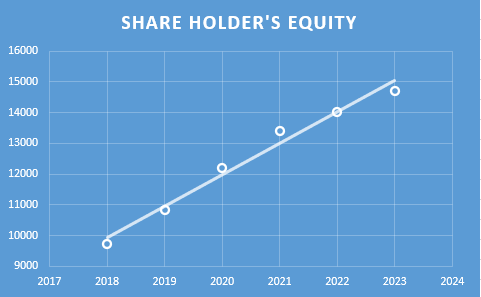
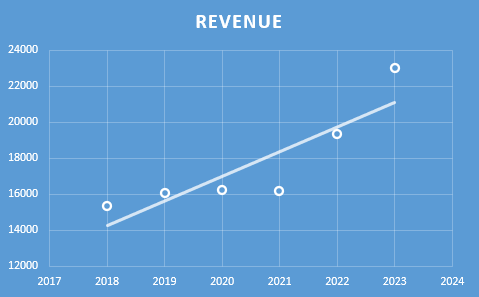
- The increase in Shareholder’s equity is assumed to be Rs. 509.00 Crores per year for the first five years and then Rs 254.50 Crores from sixth to tenth year. The growth rate is projected based on the past growth of Shareholder’s equity (refer to figure below). In the past Shareholder’s equity has increased at the rate of Rs. 1018.00 Crores per year, however, with a conservative outlook we have taken 50% of that figure for the first five years and 25% of that for the next five years.
- Terminal growth rate is assumed to be 0%.
- Discount rate is assumed to be 12%.
- Increase in Revenue is assumed to be Rs.684.35 crores per year for the first five years and then Rs 342.17 crores per year for the next five years. This growth rate is based on analysis of previous year’s revenues (refer to figure below). In the past revenue has increased at the rate of Rs. 1368.69 crores per year, however, with a conservative outlook we have taken 50% of that figure for the first five years and 25% of that for the next five years.
- Free cash flow will be 1% of revenues in future. The FCF/Revenue ratio for the period under consideration has an average of 0.01. Here we assume that the same average will hold good for future.
Based on the above assumptions we have arrived at two levels as intrinsic value of the firm. One is based on extrapolation of Shareholder’s Equity and the other is based on Free cash flows derived from extrapolated values of revenues. Both the methods only differ in how the input values are derived; in both the cases the present value is arrived at using Discounted Cash Flow Method.
Shareholder’s Equity Growth Model
Intrinsic Value: Rs. 16115.94
Stock Entry price with 25% margin of safety: Rs.12086.96
Revenue Growth Model
Intrinsic Value: Rs. 4442.58
Stock Entry price with 25% margin of safety: Rs. 3331.94
The average of the above two stock entry prices works out to be Rs. 7709.45. When the stock starts trading below this price it becomes attractive for long term investment.
Author
Jibu Dharmapalan
Fundamental Analyst
If You Like This Content 👇👇👇
Click Here To Join Us on Telegram For Free Live Interactive Discussion And Learning
Disclaimer: This is not a stock advise. Investors must use their due diligence before buy/selling any stocks.
References:
https://www.bseindia.com/stock-share-price/mrf-ltd/mrf/500290/financials-annual-reports/
https://www.mrftyres.com/financial-results
More about the Company:
Board Of Directors
|
KM Mammen |
Chairman & Managing Director |
|
Arun Mammen |
Vice Chairman & Managing Director |
|
Rahul Mammen Mappillai |
Managing Director |
|
Samir Thariyan Mappillai |
Whole-Time Director |
|
Varun Mammen |
Whole-Time Director |
|
Ashok Jacob |
Director |
|
V Sridhar |
Director |
|
Vijay R Kirloskar |
Director |
|
Ranjit I Jesudasen |
Director |
|
Dr. Salim Joseph Thomas |
Director |
|
Jacob Kurian |
Director |
|
Dr. Cibi Mammen |
Director |
|
Ambika Mammen |
Director |
|
Vimala Abraham |
Director |
Click Here To Go To Home Page
Click Here To Go To Previous Post

")
")
")
(Modified)")
")
")