
")
")
")
")
")
")
")
")
")
")
Fundamental Analysis And Intrinsic Value Of TGV SRAAC Ltd.(2023)
Dated: 19 Jul 23
Company: TGV SRAAC Ltd.
CMP: Rs. 98.45
Market Capitalisation: Rs. 1054.3 Cr.
Intrinsic Value of TGV SRAAC Ltd.
In this article we will try to analyze TGV SRAAC Ltd. based on previous six years of financial statements viz Balance sheet, Profit and Loss statement and Cash flow statement. With this fundamental analysis we will try to gain insight into the financial health, operating efficiency and profitability of the company and finally try to derive the intrinsic value of the stock using Discounted Cash Flow method and the price at which the stock becomes attractive for long term investment.
TGV SRAAC Ltd. is the flagship company of TGV Group. The company operates in three segments Chemicals, Oils and Fats and Power. Of these Chemicals contribute 94% and Oil and Fats contribute 6% of revenues. Power generation arm is still in nascent stages and has not begun contributions towards revenue yet. The company serves petroleum, paper, pharmaceutical, agro chemicals and textile industries. Almost entire production of the company is absorbed within the country.
Note: Here we are carrying out only the quantitative fundamental analysis of the company as the qualitative analysis is more subjective and individual views may vary vastly.


Before we enter into the calculation of Intrinsic value of TGV SRAAC Ltd. we have to make some logical assumptions based on the previous six years financial statements and ongoing yield for 10y Government Of India bonds.
Assumptions:
- Terminal growth rate is assumed to be 0%.
- Discount rate is assumed to be 12%.
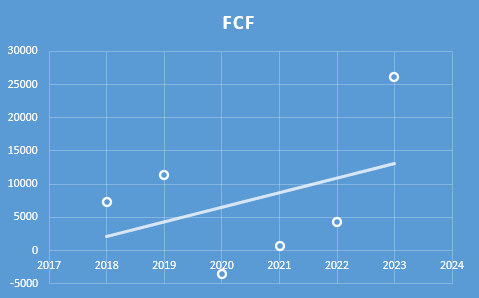
- The increase in Free Cash Flow is assumed to be Rs. 1099.91 lakhs per year for the first five years and then Rs 549.96 lakhs from sixth to tenth year. The growth rate is projected based on the past growth of Free Cash Flow (refer to figure below). In the past Free Cash Flow has increased at the rate of Rs. 2199.82 lakhs per year, however, with a conservative outlook we have taken 50% of that figure for the first five years and 25% of that for the next five years.
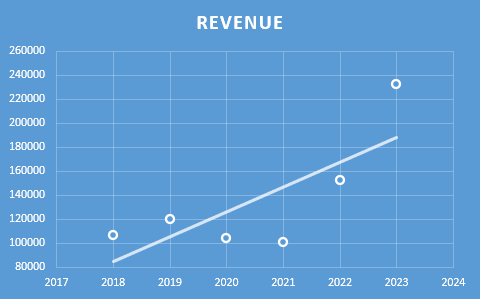
- Increase in Revenue is assumed to be Rs. 10284.17 lakhs per year for the first five years and then Rs 5142.09 lakhs per year for the next five years. This growth rate is based on analysis of previous year’s revenues (refer to figure below). In the past revenue has increased at the rate of Rs. 20568.35 lakhs per year, however, with a conservative outlook we have taken 50% of that figure for the first five years and 25% of that for the next five years.
- Free cash flow will be 5% of revenues in future. The FCF/Revenue ratio for the period under consideration has an average of 0.05. We assume that this ratio will hold good for future.
Based on the above assumptions we have arrived at two levels as intrinsic value of the firm. One is based on extrapolation of Free Cash Flow and the other is based on Free cash flows derived from extrapolated values of revenues. Both the methods only differ in how the input values are derived; in both the cases the present value is arrived at using Discounted Cash Flow Method.
Free Cash Flow Growth Model
Intrinsic Value: Rs. 98.83
Stock Entry price with 25% margin of safety: Rs. 74.12
Revenue Growth Model
Intrinsic Value: Rs. 93.77
Stock Entry price with 25% margin of safety: Rs. 70.33
The average of the above two stock entry prices works out to be Rs. 72.23. When the stock starts trading below this price it becomes attractive for long term investment.
**************************************************
Fundamental Analysis Of TGV SRAAC Ltd.
Leverage Ratios
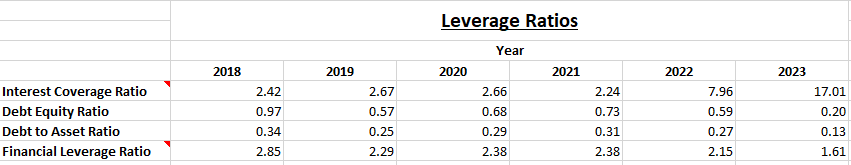
Observations:
- The Company has managed to bring down its debt during this period. Post COVID year 2020 there has been a consistent reduction in debt levels.
Operating Ratios
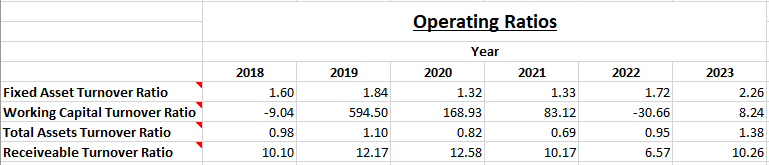
Observations:
- There have been two instances when the company operated with negative working capital. These are the times when the company has to rely on additional short-term financing to meet current obligations. However, this doesn’t appear to be a permanent feature with the company.
Profitability Ratios
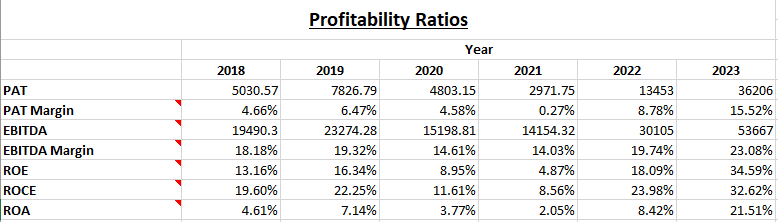
Observations:
- The company has managed to improve PAT and PAT margins which is noteworthy. We see margins shrinking in 2021 as most of the financial year 2020-21 was under lockdown caused by COVID, however it is commendable that the company managed to be in profit.
- EBITDA has almost doubled during this period and post COVID it is on a consistent growth trajectory.
Author
Jibu Dharmapalan
Fundamental Analyst
If You Like This Content 👇👇👇
Click Here To Join Us on Telegram For Free Live Interactive Discussion And Learning
Disclaimer: This is not a stock advise. Investors must use their due diligence before buy/selling any stocks.
References:
https://www.tgvgroup.com/investors.html
https://www.bseindia.com/stock-share-price/tgv-sraac-ltd/tgvsl/507753/financials-annual-reports/
Click here for Home Page


")
")
")
")
")
")
Good. Some of your SMALL CAP. companies are of interest to me. If and when the market CORRECTS, then a Rs. 100 company may become a Rs. 40 share co. and I can, then purchase such shares. Keep me in your emailing list and let me know of ANY OTHER sources of Analysis/Recimmendations LOW-PRICED shares/companies. Thanks.