
")
")
")
")
")
")
")
")
")
")

Fundamental Analysis And Intrinsic Value Of Maruti Suzuki India Ltd.(2023-24)
In this article we will try to analyze Maruti Suzuki India Ltd. based on previous six years of financial statements viz Balance sheet, Profit and Loss statement and Cash flow statement. With this fundamental analysis we will try to gain insight into the financial health, operating efficiency and profitability of the company and finally try to derive the intrinsic value of the stock using Discounted Cash Flow method and the price at which the stock becomes attractive for long term investment.
Dated: 09 Aug 23
Company: Maruti Suzuki India Ltd.
CMP: Rs. 9463.35
Market Capitalisation: Rs. 2,85,868.93 Cr.
Intrinsic Value of Maruti Suzuki India Ltd.
Maruti Suzuki India Ltd. is the most prominent automobile manufacturer of India and controls 42% of India’s passenger car market. The company is known for making reliable and low-maintenance cars. The Company has its manufacturing facilities in Gurugram and Manesar and a manufacturing facility in Gujarat. The company manufacturers vehicles in Hatchback, Sedan, SUV, Off road SUV, MUV and Pick up segments. The company plans to triple its exports by 2030 and is expected to reach production levels of 4 million units by that time which is twice the present capacity. For this the construction work at the first site has already started at Kharkhoda, Haryana and site is being identified for second facility with a production capacity of 1 million units.
Note: Here we are carrying out only the quantitative fundamental analysis of the company as the qualitative analysis is more subjective and individual views may vary vastly.
Before we enter into the calculation of Intrinsic value of Maruti Suzuki India Ltd. we have to make some logical assumptions based on the previous six years financial statements and ongoing yield for 10y Government Of India bonds.
Assumptions:
- Terminal growth rate is assumed to be 0%.
- Discount rate is assumed to be 12%.
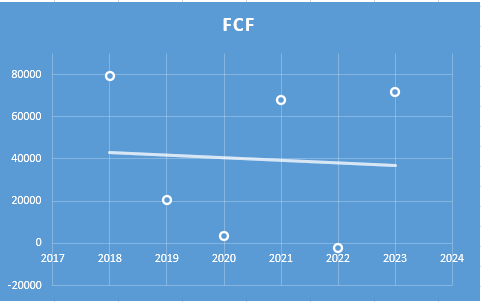
- Since the company has made heavy expenditure in year 2022 and 2023 as a part of planned expansion, it has seen a negative impact on free cash flow during these two years. However, we have assumed that the company needs to spend about Rs. 22000/- million every year towards purchase of property, plant and machinery as in normal course during these years for the purpose of calculation. Based on this the increase in Free Cash Flow is assumed to be -Rs. 581.89 million per year for the first five years and then -Rs 290.94 million from sixth to tenth year. The growth rate is projected based on the past growth of Free Cash Flow (refer to figure below). In the past Free Cash Flow has increased at the rate of -Rs. 1163.77 million per year, however, with a moderate outlook we have taken 50% of that figure for the first five years and 25% of that for the next five years.
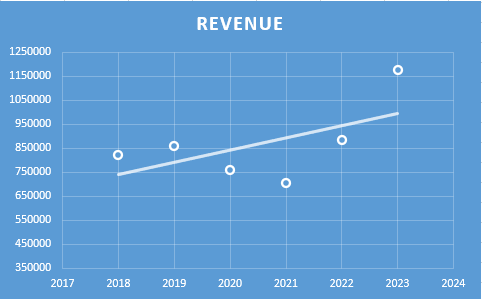
- Increase in Revenue is assumed to be Rs. 25592.41 million per year for the first five years and then Rs 12796.21 million per year for the next five years. This growth rate is based on analysis of previous year’s revenues (refer to figure below). In the past revenue has increased at the rate of Rs. 51184.83 million per year, however, with a conservative outlook we have taken 50% of that figure for the first five years and 25% of that for the next five years.
- Free cash flow will be 4% of revenues in future. The FCF/Revenue ratio for the period under consideration has an average of 0.04. We assume that this ratio will hold good for future.
Based on the above assumptions we have arrived at two levels as intrinsic value of the firm. One is based on extrapolation of Free Cash Flow and the other is based on Free cash flows derived from extrapolated values of revenues. Both the methods only differ in how the input values are derived; in both the cases the present value is arrived at using Discounted Cash Flow Method.
Free Cash Flow Growth Model
Intrinsic Value: Rs. 882.33
Stock Entry price with 25% margin of safety: Rs. 661.75
Revenue Growth Model
Intrinsic Value: Rs. 1243.98
Stock Entry price with 25% margin of safety: Rs. 932.98
The average of the above two stock entry prices works out to be Rs. 797.37. When the stock starts trading below this price it becomes attractive for long term investment.
****************************************************
Fundamental Analysis Of Maruti Suzuki India Ltd.
Leverage Ratios
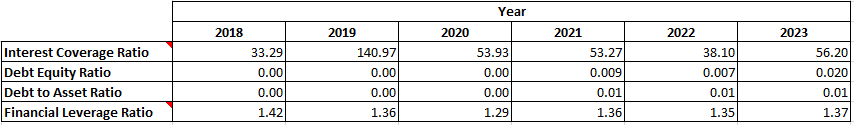
Observations:
- The company is operating with almost zero debt and is maintaining a healthy interest coverage ratio.
Operating Ratios
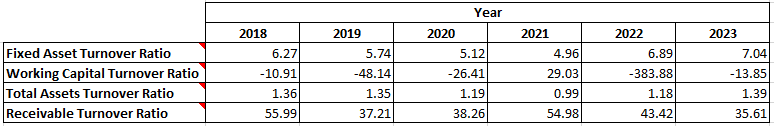
Observations:
- The company is operating with negative working capital. This is because the current liabilities exceed the current assets which may be a cause of concern, however, in this case it is due to the advances received against undelivered finished goods.
Profitability Ratios
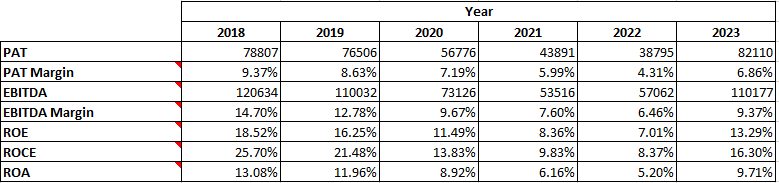
Observations:
- Company has witnessed decrease in PAT and EBITDA till year 2022. What makes this worrisom is that it is clubbed with fall in PAT and EBITDA margins as well. This clearly is the result of pressure from competitors. Though the company has now entered into SUV segment but it is yet to pick up. Further, the company is yet to enter the EV segment and is already very late while competitors like Tata Motors, Mahindra, MG, Hyundai etc. have already launched EVs.
- All other ratios ROE, ROCE and ROA have seen decline during this period.
Author
Jibu Dharmapalan
Fundamental Analyst
If You Like This Content, Please Click Here To Join Us on Telegram For Free Live Interactive Discussion And Learning
Disclaimer: This is not a stock advise. Investors must use their due diligence before buy/selling any stocks.
References:
https://www.bseindia.com/stock-share-price/maruti-suzuki-india-ltd/maruti/532500/
https://www.marutisuzuki.com/corporate/investors
Click Here for Home
FAQs
What is Intrinsic Value?
Ans: When someone invests in an asset, he does so in order to earn money from the business. The investor gets paid over a period of time as long as he is invested in the asset. Now intrinsic value is the present value of all such future cash flows generated by the asset. So logically one should not invest in any asset if the ask price is more than the intrinsic value of the asset.
How is Intrinsic Value of a company calculated?
Ans: For calculating the intrinsic value of a company all its future cash flows are extrapolated based on the past performance of the company, assumptions about the future growth of the company and its terminal value. Once all these are calculated these are brought to the present date based on appropriate discounting rate. The sum of all these gives the intrinsic value of the company. It may be more or less than the market capitalization of the company. If it is more than the market capitalization of the company then the company is said to be undervalued and is a good bet as a long-term investment and vice versa.
How is Intrinsic Value of a share calculated?
Ans: Once intrinsic value of a company is calculated as explained above, it is divided by the total number of outstanding shares of the company. This gives the intrinsic value of a share.
What is Discounted Cash Flow?
Ans: When we have cash flows that are spread over a period of time then Discounted Cash Flow method is used to calculate present value of all such cash flows. The present value depends on the discounting rate used. Usually 10 year Government bond yield rate(risk free rate of return) is used as the discounting rate.


")
")
")
")
")
")