
")
")
")
")
")
")
")
")
")
")

Fundamental Analysis And Intrinsic Value Of UPL Ltd. (2023-24)
In this article we will try to analyze UPL Ltd. based on previous six years of financial statements viz Balance sheet, Profit and Loss statement and Cash flow statement. With this fundamental analysis we will try to gain insight into the financial health, operating efficiency and profitability of the company and finally try to derive the intrinsic value of the stock using Discounted Cash Flow method and the price at which the stock becomes attractive for long term investment.
Dated: 19 Aug 23
Company: UPL Ltd.
CMP: Rs. 578.55
Market Capitalisation: Rs. 44203.85 Cr.
Intrinsic Value of UPL Ltd.
UPL Ltd. formally known as United Phosphorus Limited is a prominent name in global agricultural input industry. UPL has grown into a multinational corporation with operations across more than 130 countries. The company caters for a wide spectrum of farmer needs including agrochemicals (both pre and post harvest), specialty chemicals and seeds. The company has also emphasised on the need of farmer education for long term sustainable growth in farming.
Note: Here we are carrying out only the quantitative fundamental analysis of UPL Ltd. as the qualitative analysis is more subjective and individual views may vary vastly.
Before we enter into the calculation of Intrinsic value of UPL Ltd. we have to make some logical assumptions based on the previous six years financial statements and ongoing yield for 10y Government Of India bonds.
Assumptions:
- Terminal growth rate is assumed to be 0%.
- Discount rate is assumed to be 12%.
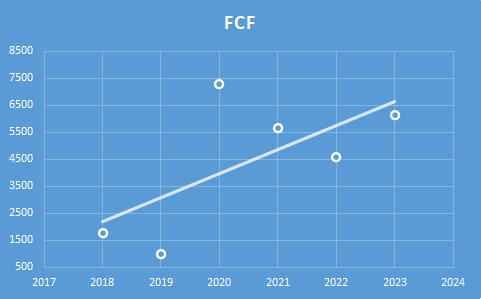
- The increase in Free Cash Flow is assumed to be Rs. 443.97 crores per year for the first five years and then Rs 221.99 crores from sixth to tenth year. The growth rate is projected based on the past growth of Free Cash Flow (refer to figure below). In the past Free Cash Flow has increased at the rate of Rs. 887.94 crores per year, however, with a moderate outlook we have taken 50% of that figure for the first five years and 25% of that for the next five years.
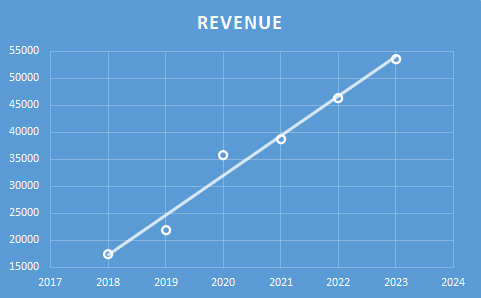
- Increase in Revenue is assumed to be Rs. 3664.24 crores per year for the first five years and then Rs 1832.12 crores per year for the next five years. This growth rate is based on analysis of previous year’s revenues (refer to figure below). In the past revenue has increased at the rate of Rs. 7328.49 crores per year, however, with a conservative outlook we have taken 50% of that figure for the first five years and 25% of that for the next five years.
- Free cash flow will be 12% of revenues in future. The FCF/Revenue ratio for the period under consideration has an average of 0.12. We assume that this ratio will hold good for future.
Based on the above assumptions we have arrived at two levels as intrinsic value of the firm. One is based on extrapolation of Free Cash Flow and the other is based on Free cash flows derived from extrapolated values of revenues. Both the methods only differ in how the input values are derived; in both the cases the present value is arrived at using Discounted Cash Flow Method.
Free Cash Flow Growth Model
Intrinsic Value: Rs. 755.06
Stock Entry price with 25% margin of safety: Rs. 566.29
Revenue Growth Model
Intrinsic Value: Rs. 971.40
Stock Entry price with 25% margin of safety: Rs. 728.55
The average of the above two stock entry prices works out to be Rs. 647.42. When the stock starts trading below this price it becomes attractive for long term investment.
****************************************************
Fundamental Analysis Of UPL Ltd.
Leverage Ratios
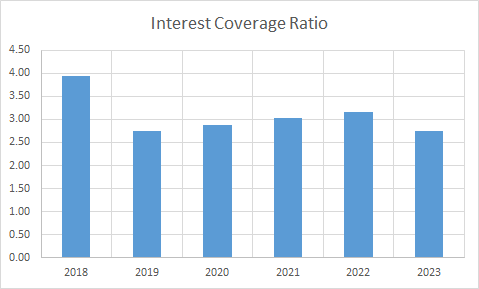
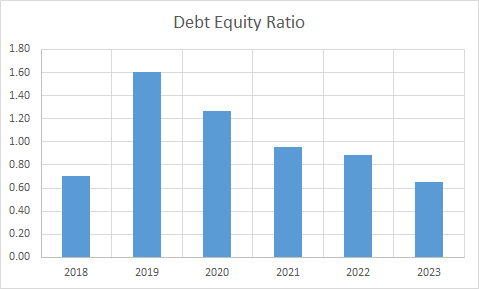

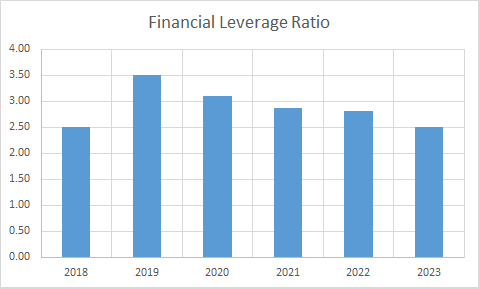
Observations:
- The company’s debt has remained fairly stable except for year 2019 and 2020. In absolute terms the company had significantly lower debt in year 2018. The increase in debt(in absolute terms) is in line with the increase in revenue.
Operating Ratios
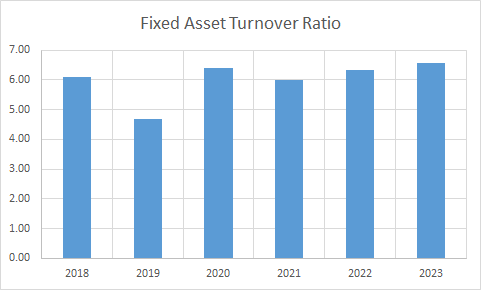
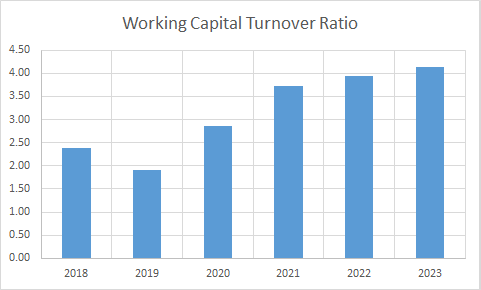
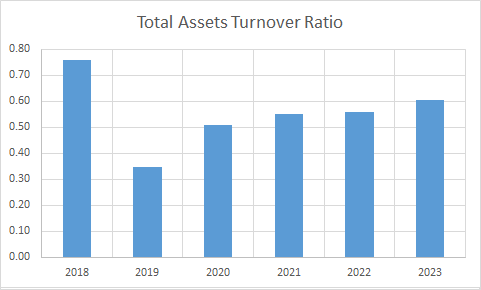
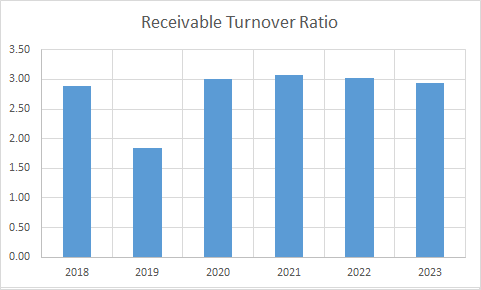
Observations:
- Working capital turnover has improved during the period.
- Fixed asset turnover ratio has remained fairly stable during the period. This indicates that the revenue has grown at par with the addition of property, plant and machinery.
Profitability Ratios
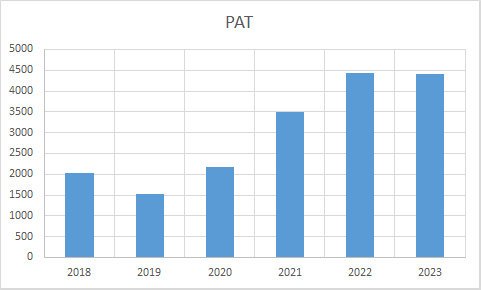
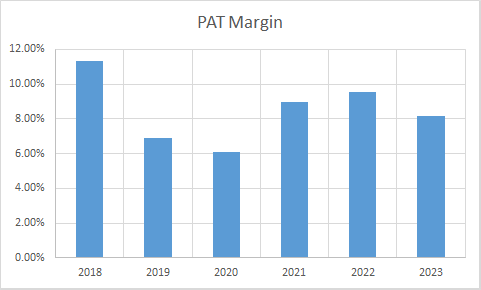
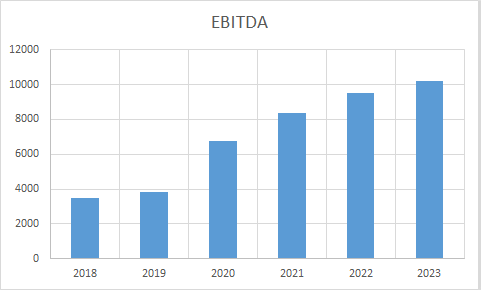
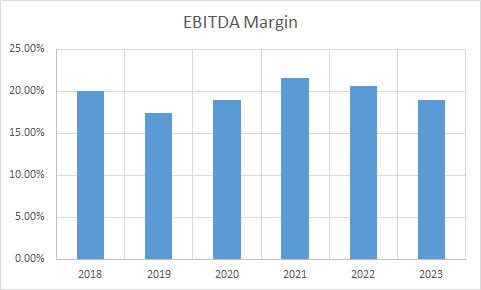
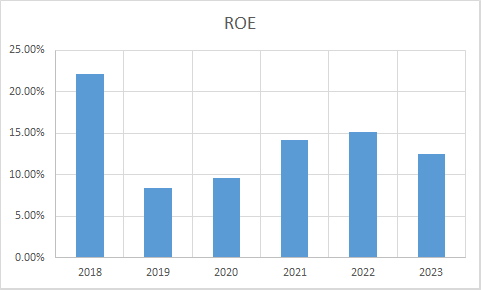
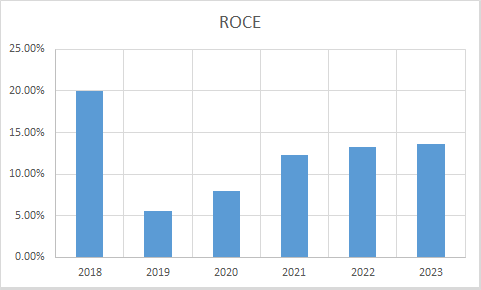
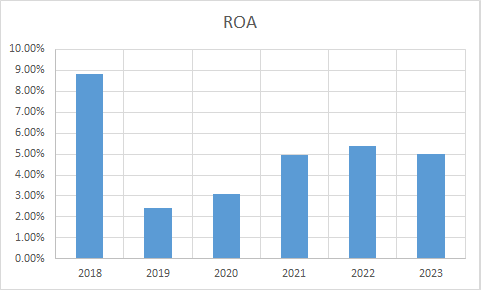
Observations:
- PAT has more than doubled during this period.
- PAT and EBITDA margins have slightly declined as compared to year 2018. However, these figures have been quite stable since 2019. This may be because year 2018 was exceptionally good for the company. It is noteworthy that PAT and EBITDA margins held good during years 2019 and 2020, though they were the least during these years.
Author
Jibu Dharmapalan
Fundamental Analyst
Disclaimer:
This article is for educational purpose only. Investment in securities market is subject to market risks. Please consult your Financial Advisor before investing.
If You Like This Content 
Click Here To Join Us on Facebook For Free Live Interactive Discussion And Learning
References:
https://www.bseindia.com/stock-share-price/upl-limited/upl/512070/financials-annual-reports/
https://www.upl-ltd.com/investors/financial-results-and-reports/annual-reports
Click Here for Home
FAQs
What is Intrinsic Value?
Ans: When someone invests in an asset, he does so in order to earn money from the business. The investor gets paid over a period of time as long as he is invested in the asset. Now intrinsic value is the present value of all such future cash flows generated by the asset. So logically one should not invest in any asset if the ask price is more than the intrinsic value of the asset.
How is Intrinsic Value of a company calculated?
Ans: For calculating the intrinsic value of a company all its future cash flows are extrapolated based on the past performance of the company, assumptions about the future growth of the company and its terminal value. Once all these are calculated these are brought to the present date based on appropriate discounting rate. The sum of all these gives the intrinsic value of the company. It may be more or less than the market capitalization of the company. If it is more than the market capitalization of the company then the company is said to be undervalued and is a good bet as a long-term investment and vice versa.
How is Intrinsic Value of a share calculated?
Ans: Once intrinsic value of a company is calculated as explained above, it is divided by the total number of outstanding shares of the company. This gives the intrinsic value of a share.
What is Discounted Cash Flow?
Ans: When we have cash flows that are spread over a period of time then Discounted Cash Flow method is used to calculate present value of all such cash flows. The present value depends on the discounting rate used. Usually 10 year Government bond yield rate(risk free rate of return) is used as the discounting rate.


")
")
")
")
")
")