")
")
")
")
")
")
")
")
")
")

Fundamental Analysis And Intrinsic Value Of Vedanta Ltd.(2023-24)
In this article we will try to analyze Vedanta Ltd. based on previous six years of financial statements viz Balance sheet, Profit and Loss statement and Cash flow statement. With this fundamental analysis we will try to gain insight into the financial health, operating efficiency and profitability of the company and finally try to derive the intrinsic value of the stock using Discounted Cash Flow method and the price at which the stock becomes attractive for long term investment.
Dated: 22 Aug 23
Company: Vedanta Ltd.
CMP: Rs. 235.20
Market Capitalisation: Rs. 87,428.46 Cr.
Intrinsic Value of Vedanta Ltd.
Vedanta Ltd. is a prominent name in Indian metal Industry and has established itself as a key player in extraction and production of various metals and minerals. The company operates across various segments including zinc, aluminum, iron ore, copper, power generation and oil and gas. The company is constantly expanding, evolving and venturing in diversified fields and embracing new technologies.
Note: Here we are carrying out only the quantitative fundamental analysis of Vedanta Ltd. as the qualitative analysis is more subjective and individual views may vary vastly.
Before we enter into the calculation of Intrinsic value of Vedanta Ltd. we have to make some logical assumptions based on the previous six years financial statements and ongoing yield for 10y Government Of India bonds.
Assumptions:
- Terminal growth rate is assumed to be 0%.
- Discount rate is assumed to be 12%.
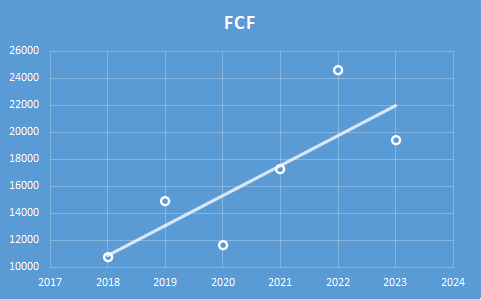
- The increase in Free Cash Flow is assumed to be Rs. 1116.37 crores per year for the first five years and then Rs 558.19 crores from sixth to tenth year. The growth rate is projected based on the past growth of Free Cash Flow (refer to figure below). In the past Free Cash Flow has increased at the rate of Rs. 2232.74 crores per year, however, with a moderate outlook we have taken 50% of that figure for the first five years and 25% of that for the next five years.
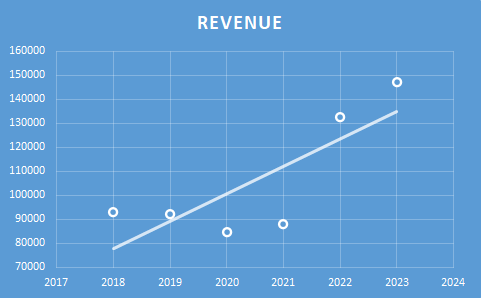
- Increase in Revenue is assumed to be Rs. 5679.30 crores per year for the first five years and then Rs 2839.65 crores per year for the next five years. This growth rate is based on analysis of previous year’s revenues (refer to figure below). In the past revenue has increased at the rate of Rs. 11358.60 crores per year, however, with a conservative outlook we have taken 50% of that figure for the first five years and 25% of that for the next five years.
- Free cash flow will be 15% of revenues in future. The FCF/Revenue ratio for the period under consideration has an average of 0.15. We assume that this ratio will hold good for future.
Based on the above assumptions we have arrived at two levels as intrinsic value of the firm. One is based on extrapolation of Free Cash Flow and the other is based on Free cash flows derived from extrapolated values of revenues. Both the methods only differ in how the input values are derived; in both the cases the present value is arrived at using Discounted Cash Flow Method.
Free Cash Flow Growth Model
Intrinsic Value: Rs. 376.31
Stock Entry price with 25% margin of safety: Rs. 282.23
Revenue Growth Model
Intrinsic Value: Rs. 551.75
Stock Entry price with 25% margin of safety: Rs. 413.81
The average of the above two stock entry prices works out to be Rs. 348.02. When the stock starts trading below this price it becomes attractive for long term investment.
****************************************************
Fundamental Analysis Of Vedanta Ltd.
Leverage Ratios
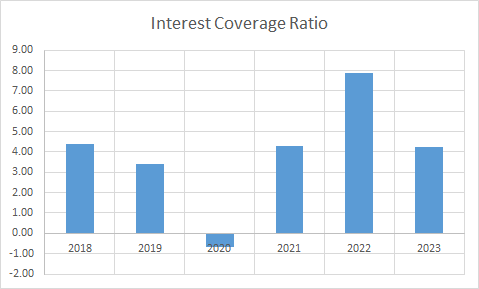
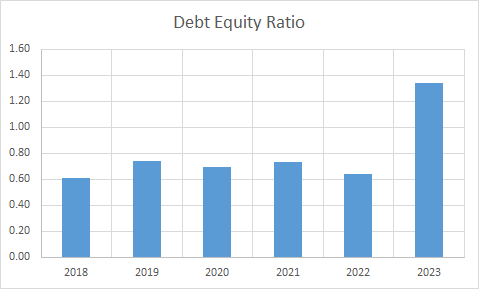
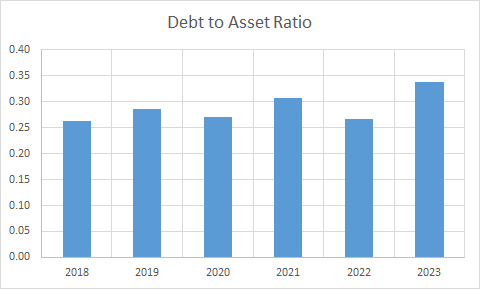

Observations:
- With debt equity ratio of 1.34 the debt levels are high, however, it is below the critical red flag level of 1.5. In absolute terms also there is an increase in debt.
- Company is maintaining a stable interest coverage ratio except for year 2020.
Operating Ratios

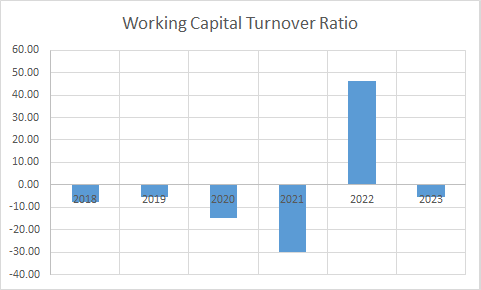
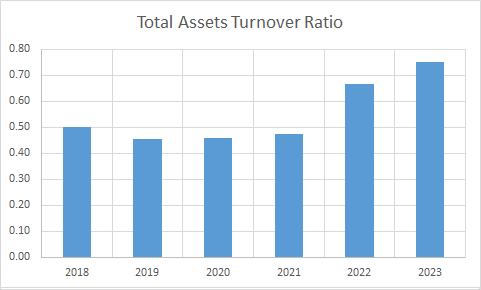
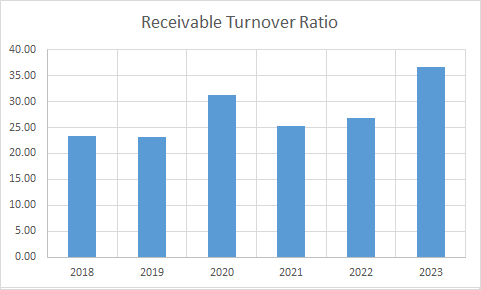
Observations:
- Company has been operating with negative working capital for most of the time during the period. A negative working capital indicates that the current assets are not sufficient to cover the current liabilities and the company may have to resort to borrowed capital to sustain operations.
- Receivables turnover ratio has shown improvement.
Profitability Ratios
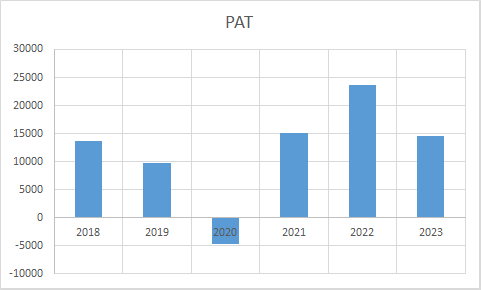

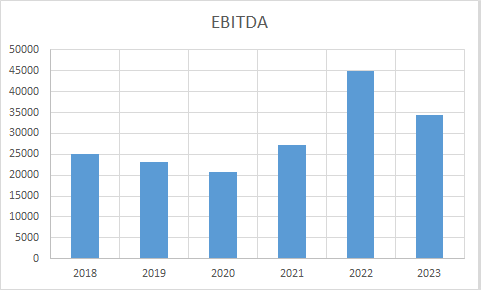
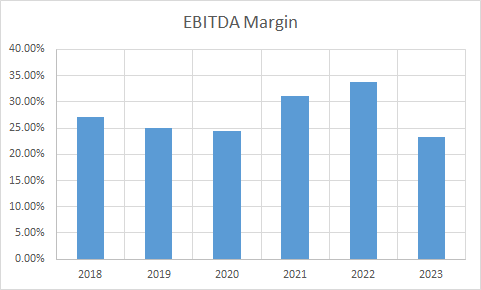
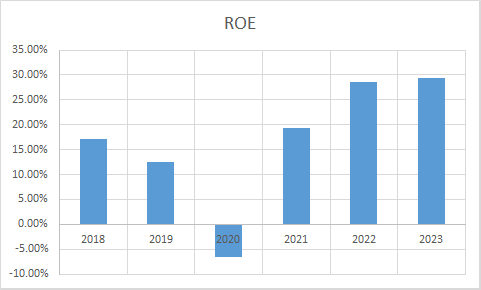

Observations:
- PAT and EBITDA have shown improvement during this period. There was an improvement in margins till year 2022, however, in 2023 the company has borrowed capital to fund expansion projects and this has added to finance cost and thereby affected margins.
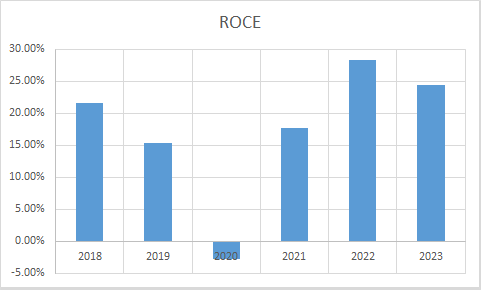
- ROE and ROCE have shown improvement. ROA has shown a decline in year 2023 as the new projects have not started output yet.
Special Note: Though the company is currently trading below intrinsic value, the investors are to exercise caution since the debt levels are just marginally below the red flag levels(D/E ratio – 1.5)
Author
Jibu Dharmapalan
Fundamental Analyst
Disclaimer:
This article is for educational purpose only. Investment in securities market is subject to market risks. Please consult your Financial Advisor before investing.
If You Like This Content 👇👇👇
Click Here To Join Us on Facebook For Free Live Interactive Discussion And Learning
References:
https://www.bseindia.com/stock-share-price/vedanta-limited/vedl/500295/financials-annual-reports/
https://www.vedantalimited.com/eng/investor-relations-overview.php#resultsReports
Click Here for Home
FAQs
What is Intrinsic Value?
Ans: When someone invests in an asset, he does so in order to earn money from the business. The investor gets paid over a period of time as long as he is invested in the asset. Now intrinsic value is the present value of all such future cash flows generated by the asset. So logically one should not invest in any asset if the ask price is more than the intrinsic value of the asset.
How is Intrinsic Value of a company calculated?
Ans: For calculating the intrinsic value of a company all its future cash flows are extrapolated based on the past performance of the company, assumptions about the future growth of the company and its terminal value. Once all these are calculated these are brought to the present date based on appropriate discounting rate. The sum of all these gives the intrinsic value of the company. It may be more or less than the market capitalization of the company. If it is more than the market capitalization of the company then the company is said to be undervalued and is a good bet as a long-term investment and vice versa.
How is Intrinsic Value of a share calculated?
Ans: Once intrinsic value of a company is calculated as explained above, it is divided by the total number of outstanding shares of the company. This gives the intrinsic value of a share.
What is Discounted Cash Flow?
Ans: When we have cash flows that are spread over a period of time then Discounted Cash Flow method is used to calculate present value of all such cash flows. The present value depends on the discounting rate used. Usually 10 year Government bond yield rate(risk free rate of return) is used as the discounting rate.


")
")
")
(Modified)")
")
")
All good & bad but Anil Agarwal threw all sorts of tantrums of delisting & what not as if investors r foolish 😳! Vedanta & it’s promoter may be sitting on a goldmine but the guy is unreliably greedy & should be the last choice considering multiple choices in the market. Jai Hind ❤