")
")
")
")
")
")
")
")
")
")

Fundamental Analysis And Intrinsic Value Of TCNS Clothing Co. Ltd.(2023-24)
In this article we will try to analyze TCNS Clothing Co. Ltd. based on previous six years of financial statements viz Balance sheet, Profit and Loss statement and Cash flow statement. With this fundamental analysis we will try to gain insight into the financial health, operating efficiency and profitability of the company and finally try to derive the intrinsic value of the stock using Discounted Cash Flow method and the price at which the stock becomes attractive for long term investment.
Dated: 13 Sep 23
Company: TCNS Clothing Co. Ltd.
CMP: Rs. 372.55
Market Capitalisation: Rs. 2354.92 Cr.
Intrinsic Value of TCNS Clothing Co. Ltd.
TCNS Clothing Co. Ltd. was established in 1997 and deals in exclusive women’s ethnic/fusion wear segment. The company has four in house brands W-for women’s fusion wear, Aurelia-contemporary ethnic wear, Wishful-designer wear and Elleven- drapes. The company has its own retail website that contributes to 20% of its overall online sales. The company is also expanding its presence with brick and mortar stores and has opened 17 new stores this year. The company also boasts the largest women’s wear distribution network with more than 4000 outlets.
Note: Here we are carrying out only the quantitative fundamental analysis of TCNS Clothing Co. Ltd. as the qualitative analysis is more subjective and individual views may vary vastly.
Before we enter into the calculation of Intrinsic value of TCNS Clothing Co. Ltd. we have to make some logical assumptions based on the previous six years financial statements and ongoing yield for 10y Government Of India bonds.
Assumptions:
- Terminal growth rate is assumed to be 0%.
- Discount rate is assumed to be 12%.
- Free cash flow will be 6% of revenues in future. The FCF/Revenue ratio for the period under consideration has an average of 0.06. We assume that this ratio will hold good for future.
Based on the above assumptions we have arrived at two levels as intrinsic value of the firm. One is based on extrapolation of Share Holder’s Equity and the other is based on Free cash flows derived from extrapolated values of revenues. Both the methods only differ in how the input values are derived; in both the cases the present value is arrived at using Discounted Cash Flow Method.
Share Holder’s Equity Growth Model
Intrinsic Value: Rs. 55.54
Stock Entry price with 25% margin of safety: Rs. 41.65
Revenue Growth Model
Intrinsic Value: Rs. 103.88
Stock Entry price with 25% margin of safety: Rs. 77.91
The intrinsic values arrived above are not the same since the Shareholder’s Equity Model and Revenue Growth model have different growth rates. The average of the above two stock entry prices works out to be Rs. 59.78. When the stock starts trading below this price it becomes attractive for long term investment. This value is valid till the next financial year results are published or some major fundamental change takes place in the company.
****************************************************
Fundamental Analysis Of TCNS Clothing Co. Ltd.
Leverage Ratios
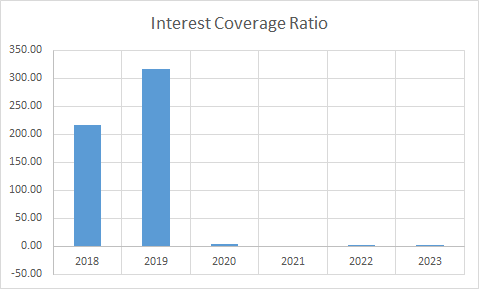
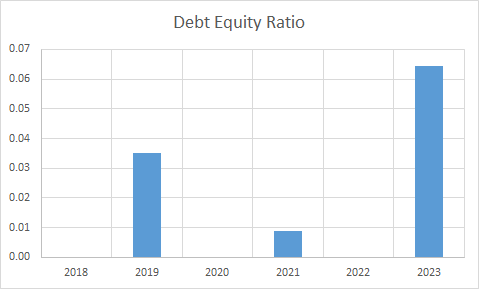
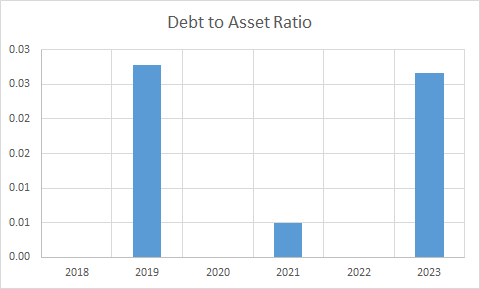
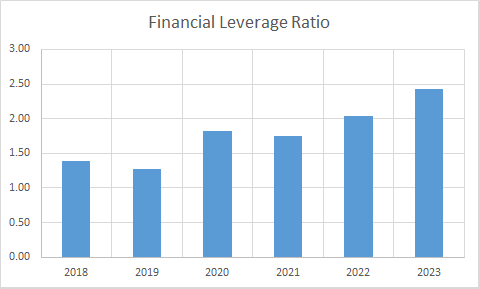
Observations:
- The Company is operating with almost no debt.
- The interest coverage ratio has dropped below 1 since 2021 as the company has been running into losses since FY 2020-21 and has booked losses this year also.
Operating Ratios
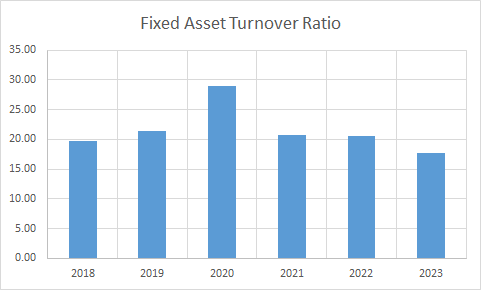
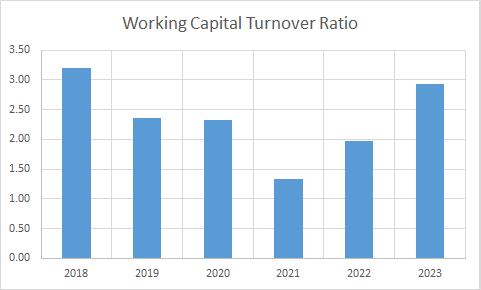
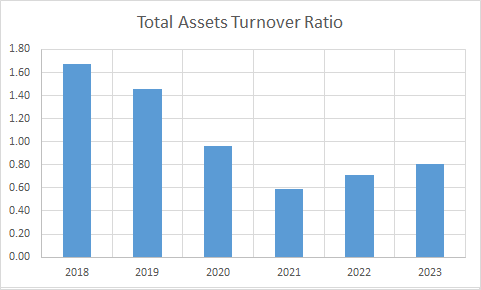
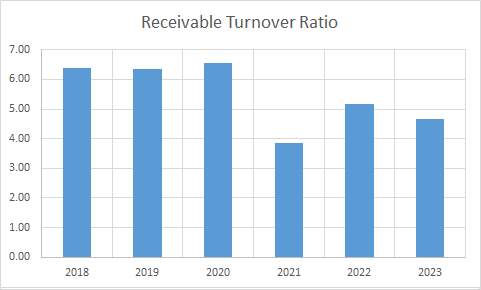
Observations:
- All fixed assets viz property, plant and machinery are optimally utilised by the company.
- It is operating with a positive working capital.
- Receivable turnover ratio has seen a slight decline during this period.
Profitability Ratios
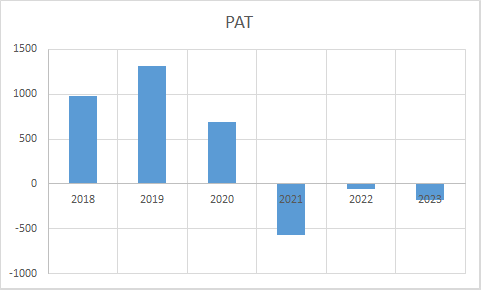
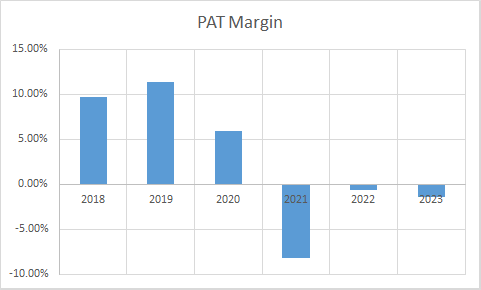
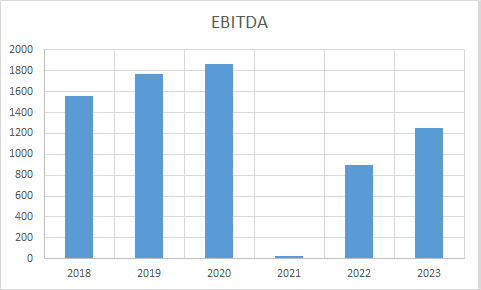
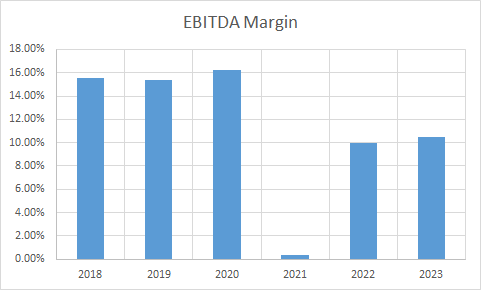
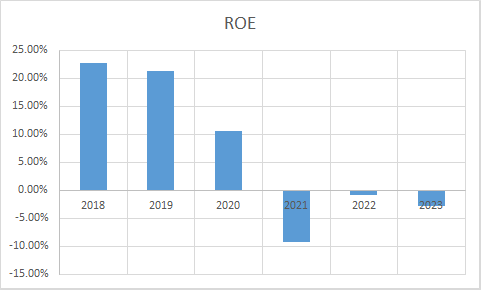
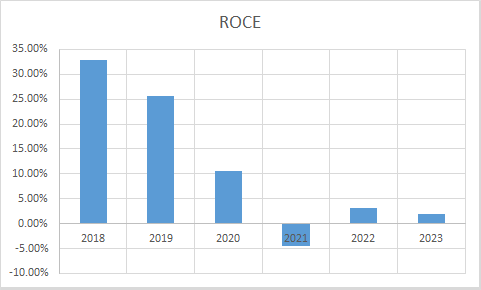
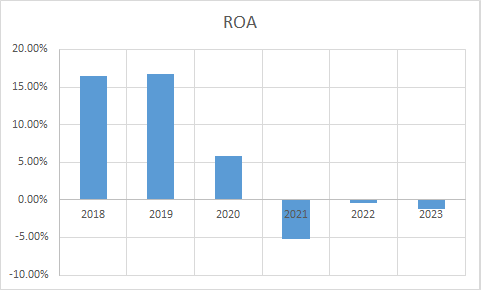
Observations:
- Company has been continuously booking losses since the past three years and has not recovered post COVID period.
- EBITDA and EBITDA margins have seen decline post COVID.
- Other ratios also have seen decline post pandemic and have not recovered yet.
Author
Jibu Dharmapalan
Fundamental Analyst
Disclaimer:
This article is for educational purpose only. Investment in securities market is subject to market risks. Please consult your Financial Advisor before investing.
If You Like This Content 👇👇👇
Click Here To Join Us on Facebook For Free Live Interactive Discussion And Learning
References:
https://www.bseindia.com/stock-share-price/tcns-clothing-co-ltd/tcnsbrands/541700/financials-annual-reports/
https://wforwoman.com/content/investor-relation
Click Here for Home
FAQs
What is Intrinsic Value?
Ans: When someone invests in an asset, he does so in order to earn money from the business. The investor gets paid over a period of time as long as he is invested in the asset. Now intrinsic value is the present value of all such future cash flows generated by the asset. So logically one should not invest in any asset if the ask price is more than the intrinsic value of the asset.
How is Intrinsic Value of a company calculated?
Ans: For calculating the intrinsic value of a company all its future cash flows are extrapolated based on the past performance of the company, assumptions about the future growth of the company and its terminal value. Once all these are calculated these are brought to the present date based on appropriate discounting rate. The sum of all these gives the intrinsic value of the company. It may be more or less than the market capitalization of the company. If it is more than the market capitalization of the company then the company is said to be undervalued and is a good bet as a long-term investment and vice versa.
How is Intrinsic Value of a share calculated?
Ans: Once intrinsic value of a company is calculated as explained above, it is divided by the total number of outstanding shares of the company. This gives the intrinsic value of a share.
What is Discounted Cash Flow?
Ans: When we have cash flows that are spread over a period of time then Discounted Cash Flow method is used to calculate present value of all such cash flows. The present value depends on the discounting rate used. Usually 10 year Government bond yield rate(risk free rate of return) is used as the discounting rate.


")
")
")
")
")
")