
")
")
")
")
")
")
")
")
")
")

Fundamental Analysis And Intrinsic Value Of NTPC Ltd.(2023-24)
In this article we will try to analyze NTPC Ltd. based on previous six years of financial statements viz Balance sheet, Profit and Loss statement and Cash flow statement. With this fundamental analysis we will try to gain insight into the financial health, operating efficiency and profitability of the company and finally try to derive the intrinsic value of the stock using Discounted Cash Flow method and the price at which the stock becomes attractive for long term investment. This article is divided in two sections as listed below :-
Section 1: Quantitative Fundamental Analysis on Financial Health, Operating Efficiency And Profitability.
Section 2: Calculation Of Intrinsic Value.
Dated: 23 Sep 23
Company: NTPC Ltd.
CMP: Rs. 237.95
Market Capitalisation: Rs. 2,30,732.17 Cr.
NTPC Ltd. stands as the nation’s largest state-owned power utility company, boasting a diversified energy generation portfolio that encompasses coal, natural gas, and renewable sources. Leveraging its immense scale, NTPC secures fuel and essential resources at highly competitive rates. In addition to serving the domestic market, the company plays a pivotal role in meeting the power demands of Nepal, Sri Lanka, and Bangladesh. NTPC is actively steering towards reduced reliance on coal-based energy production, opting for a transition to natural gas and renewable resources in its commitment to sustainable practices and addressing environmental concerns. However, the company confronts a significant challenge in the form of the heavily regulated Indian power sector, often subject to political influences.
Note: Here we are carrying out only the quantitative fundamental analysis of NTPC Ltd. as the qualitative analysis is more subjective and individual views may vary vastly.
****************************************************
Fundamental Analysis Of NTPC Ltd.
Leverage Ratios
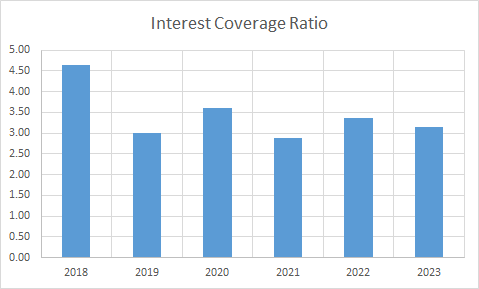
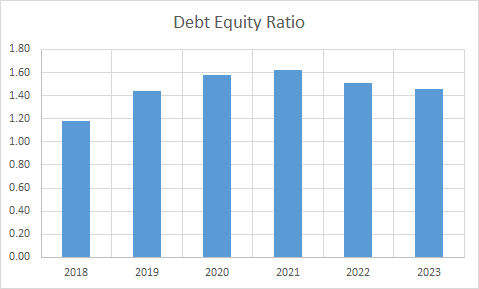
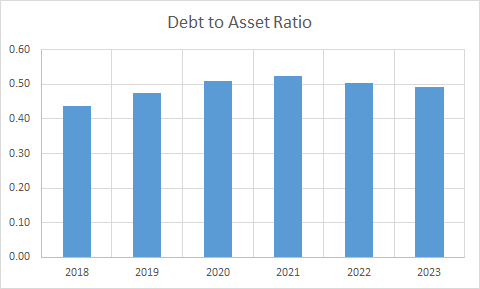
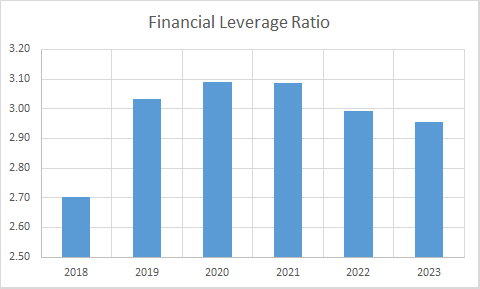
Observations:
- The company has been operating under high debt and its debt in absolute terms has almost doubled during the period and the financing expenses have tripled.
Operating Ratios
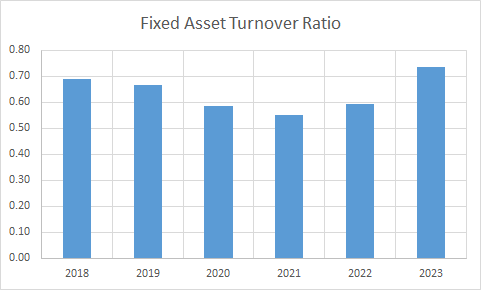
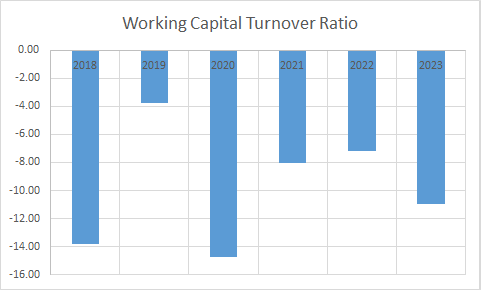
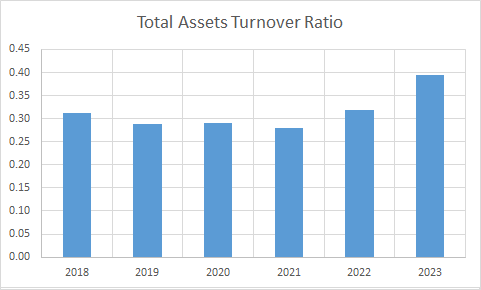
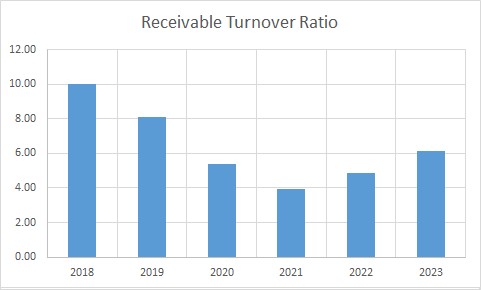
Observations:
- The company has been operating with negative working capital throughout the period under consideration. And this is one of the reasons for continuous borrowing through out the period.
- The receivables turnover ratio has also declined during the period.
Profitability Ratios
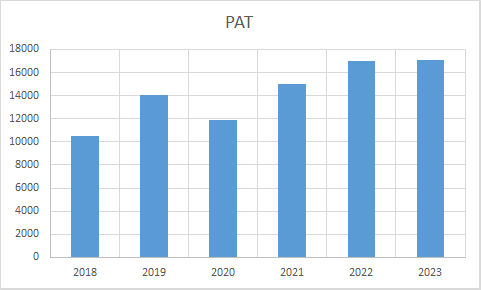
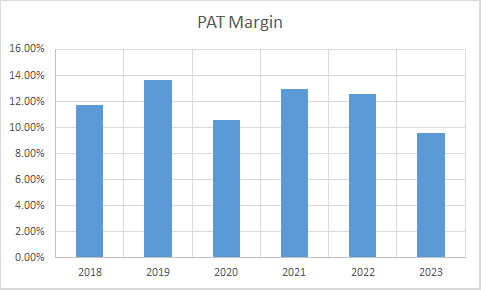
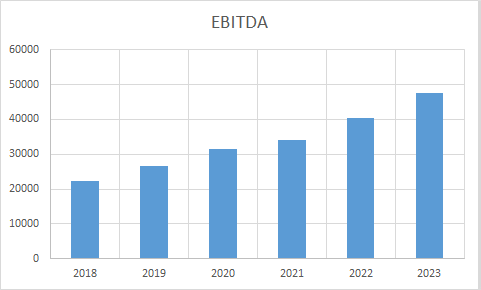
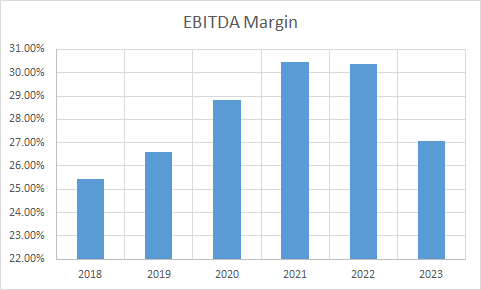
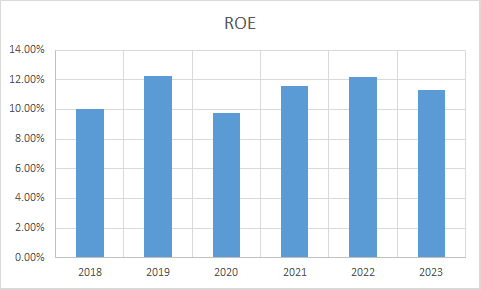
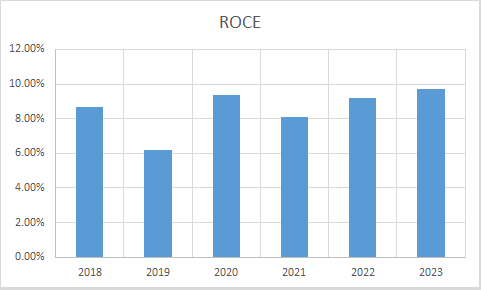
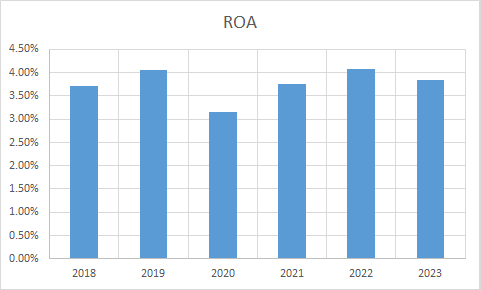
Observations:
- PAT has seen an increase during the period, however, PAT margin has seen a slight decline.
- EBITDA has seen an improvement.
****************************************************
Intrinsic Value of NTPC Ltd.
Before we enter into the calculation of Intrinsic value of NTPC Ltd. we have to make some logical assumptions based on the previous six years financial statements and ongoing yield for 10y Government Of India bonds.
Assumptions:
- Terminal growth rate is assumed to be 0%.
- Weighted Average Cost of Capital(WACC) is assumed to be 12%.
- Free cash flow will be 4% of revenues in future. The FCF/Revenue ratio for the period under consideration has an average of 0.02. We assume that this ratio will hold good for future.
Based on the above assumptions we have arrived at two levels as intrinsic value of the firm. One is based on extrapolation of Free Cash Flow and the other is based on Free cash flows derived from extrapolated values of revenues. Both the methods only differ in how the input values are derived; in both the cases the present value is arrived at using Discounted Cash Flow Method.
Free Cash Flow Growth Model
Intrinsic Value: Rs. 89.65
Stock Entry price with 25% margin of safety: Rs. 67.24
Revenue Growth Model
Intrinsic Value: Rs. 75.93
Stock Entry price with 25% margin of safety: Rs. 56.94
The intrinsic values arrived above are not the same since the Free Cash Flow model considers a pessimistic starting base value of present free cash flow for extrapolation whereas the Revenue Growth model takes the actual point on the extrapolation line for the current year. The average of the above two stock entry prices works out to be Rs. 62.09. When the stock starts trading below this price it becomes attractive for long term investment. This value is valid till the next financial year results are published or some major fundamental change takes place in the company.
****************************************************
Author
Jibu Dharmapalan
Fundamental Analyst
Disclaimer:
This article is for educational purpose only. Investment in securities market is subject to market risks. Please consult your Financial Advisor before investing.
If You Like This Content 👇👇👇
Click Here To Join Us on Facebook For Free Live Interactive Discussion And Learning
References:
https://www.bseindia.com/stock-share-price/ntpc-ltd/ntpc/532555/financials-annual-reports/
https://www.ntpc.co.in/investors/annual-reports
Click Here for Home
FAQs
What is Intrinsic Value?
Ans: When someone invests in an asset, he does so in order to earn money from the business. The investor gets paid over a period of time as long as he is invested in the asset. Now intrinsic value is the present value of all such future cash flows generated by the asset. So logically one should not invest in any asset if the ask price is more than the intrinsic value of the asset.
How is Intrinsic Value of a company calculated?
Ans: For calculating the intrinsic value of a company all its future cash flows are extrapolated based on the past performance of the company, assumptions about the future growth of the company and its terminal value. Once all these are calculated these are brought to the present date based on appropriate discounting rate. The sum of all these gives the intrinsic value of the company. It may be more or less than the market capitalization of the company. If it is more than the market capitalization of the company then the company is said to be undervalued and is a good bet as a long-term investment and vice versa.
How is Intrinsic Value of a share calculated?
Ans: Once intrinsic value of a company is calculated as explained above, it is divided by the total number of outstanding shares of the company. This gives the intrinsic value of a share.
What is Discounted Cash Flow?
Ans: When we have cash flows that are spread over a period of time then Discounted Cash Flow method is used to calculate present value of all such cash flows. The present value depends on the discounting rate used. Usually 10 year Government bond yield rate(risk free rate of return) is used as the discounting rate.


")
")
")
")
")
")