")
")
")
")
")
")
")
")
")
")
Fundamental Analysis And Intrinsic Value Of Nava Ltd. (2023-24)
In this article we will try to analyze Nava Ltd. based on previous six years of financial statements viz Balance sheet, Profit and Loss statement and Cash flow statement. With this fundamental analysis we will try to gain insight into the business activities, financial health, operating efficiency and profitability of the company and finally try to derive the intrinsic value of stock using Discounted Cash Flow method and the price at which the stock becomes attractive for long term investment. This article is divided in three sections as listed below :-
Section 1: Qualitative Fundamental Analysis comprising of General Introduction, Business overview dwelling into Business Model, Strengths and Weakness, Long Term Sustainability and finally the competitors.
Section 2:Quantitative Fundamental Analysis on Financial Health, Operating Efficiency And Profitability.
Section 3: Calculation Of Intrinsic Value.
General Info
Dated: 03 Dec 23
Company: Nava Ltd.
CMP: Rs. 383.65
Market Capitalisation: Rs. 6000.05 Cr.
Share Holding Pattern:
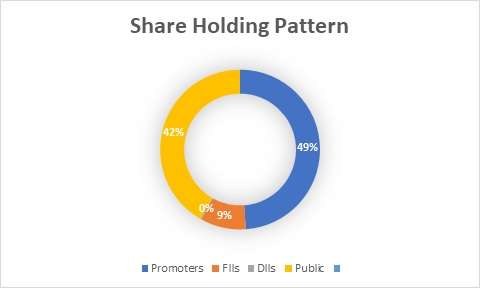
Promoters: Nav Developers Ltd., AN Investments Pvt. Ltd., SRT Investments Pvt. Ltd., Ashok Devineni, Bhaktapriya Devineni, Rajashree Pinnamaneni, Ashwin Devineni, Nikhil Devineni
Top Competitors: Tata Steel, JSW Steel, Jindal Stainless, NTPC, Tata Power, JSW EnergyNTPC Ltd., Power Grid Corporation Of India, Adani Power Ltd., Adani Green Ltd., Tata Power Ltd.
Fundamental Analysis Of Nava Ltd.
General Introduction:
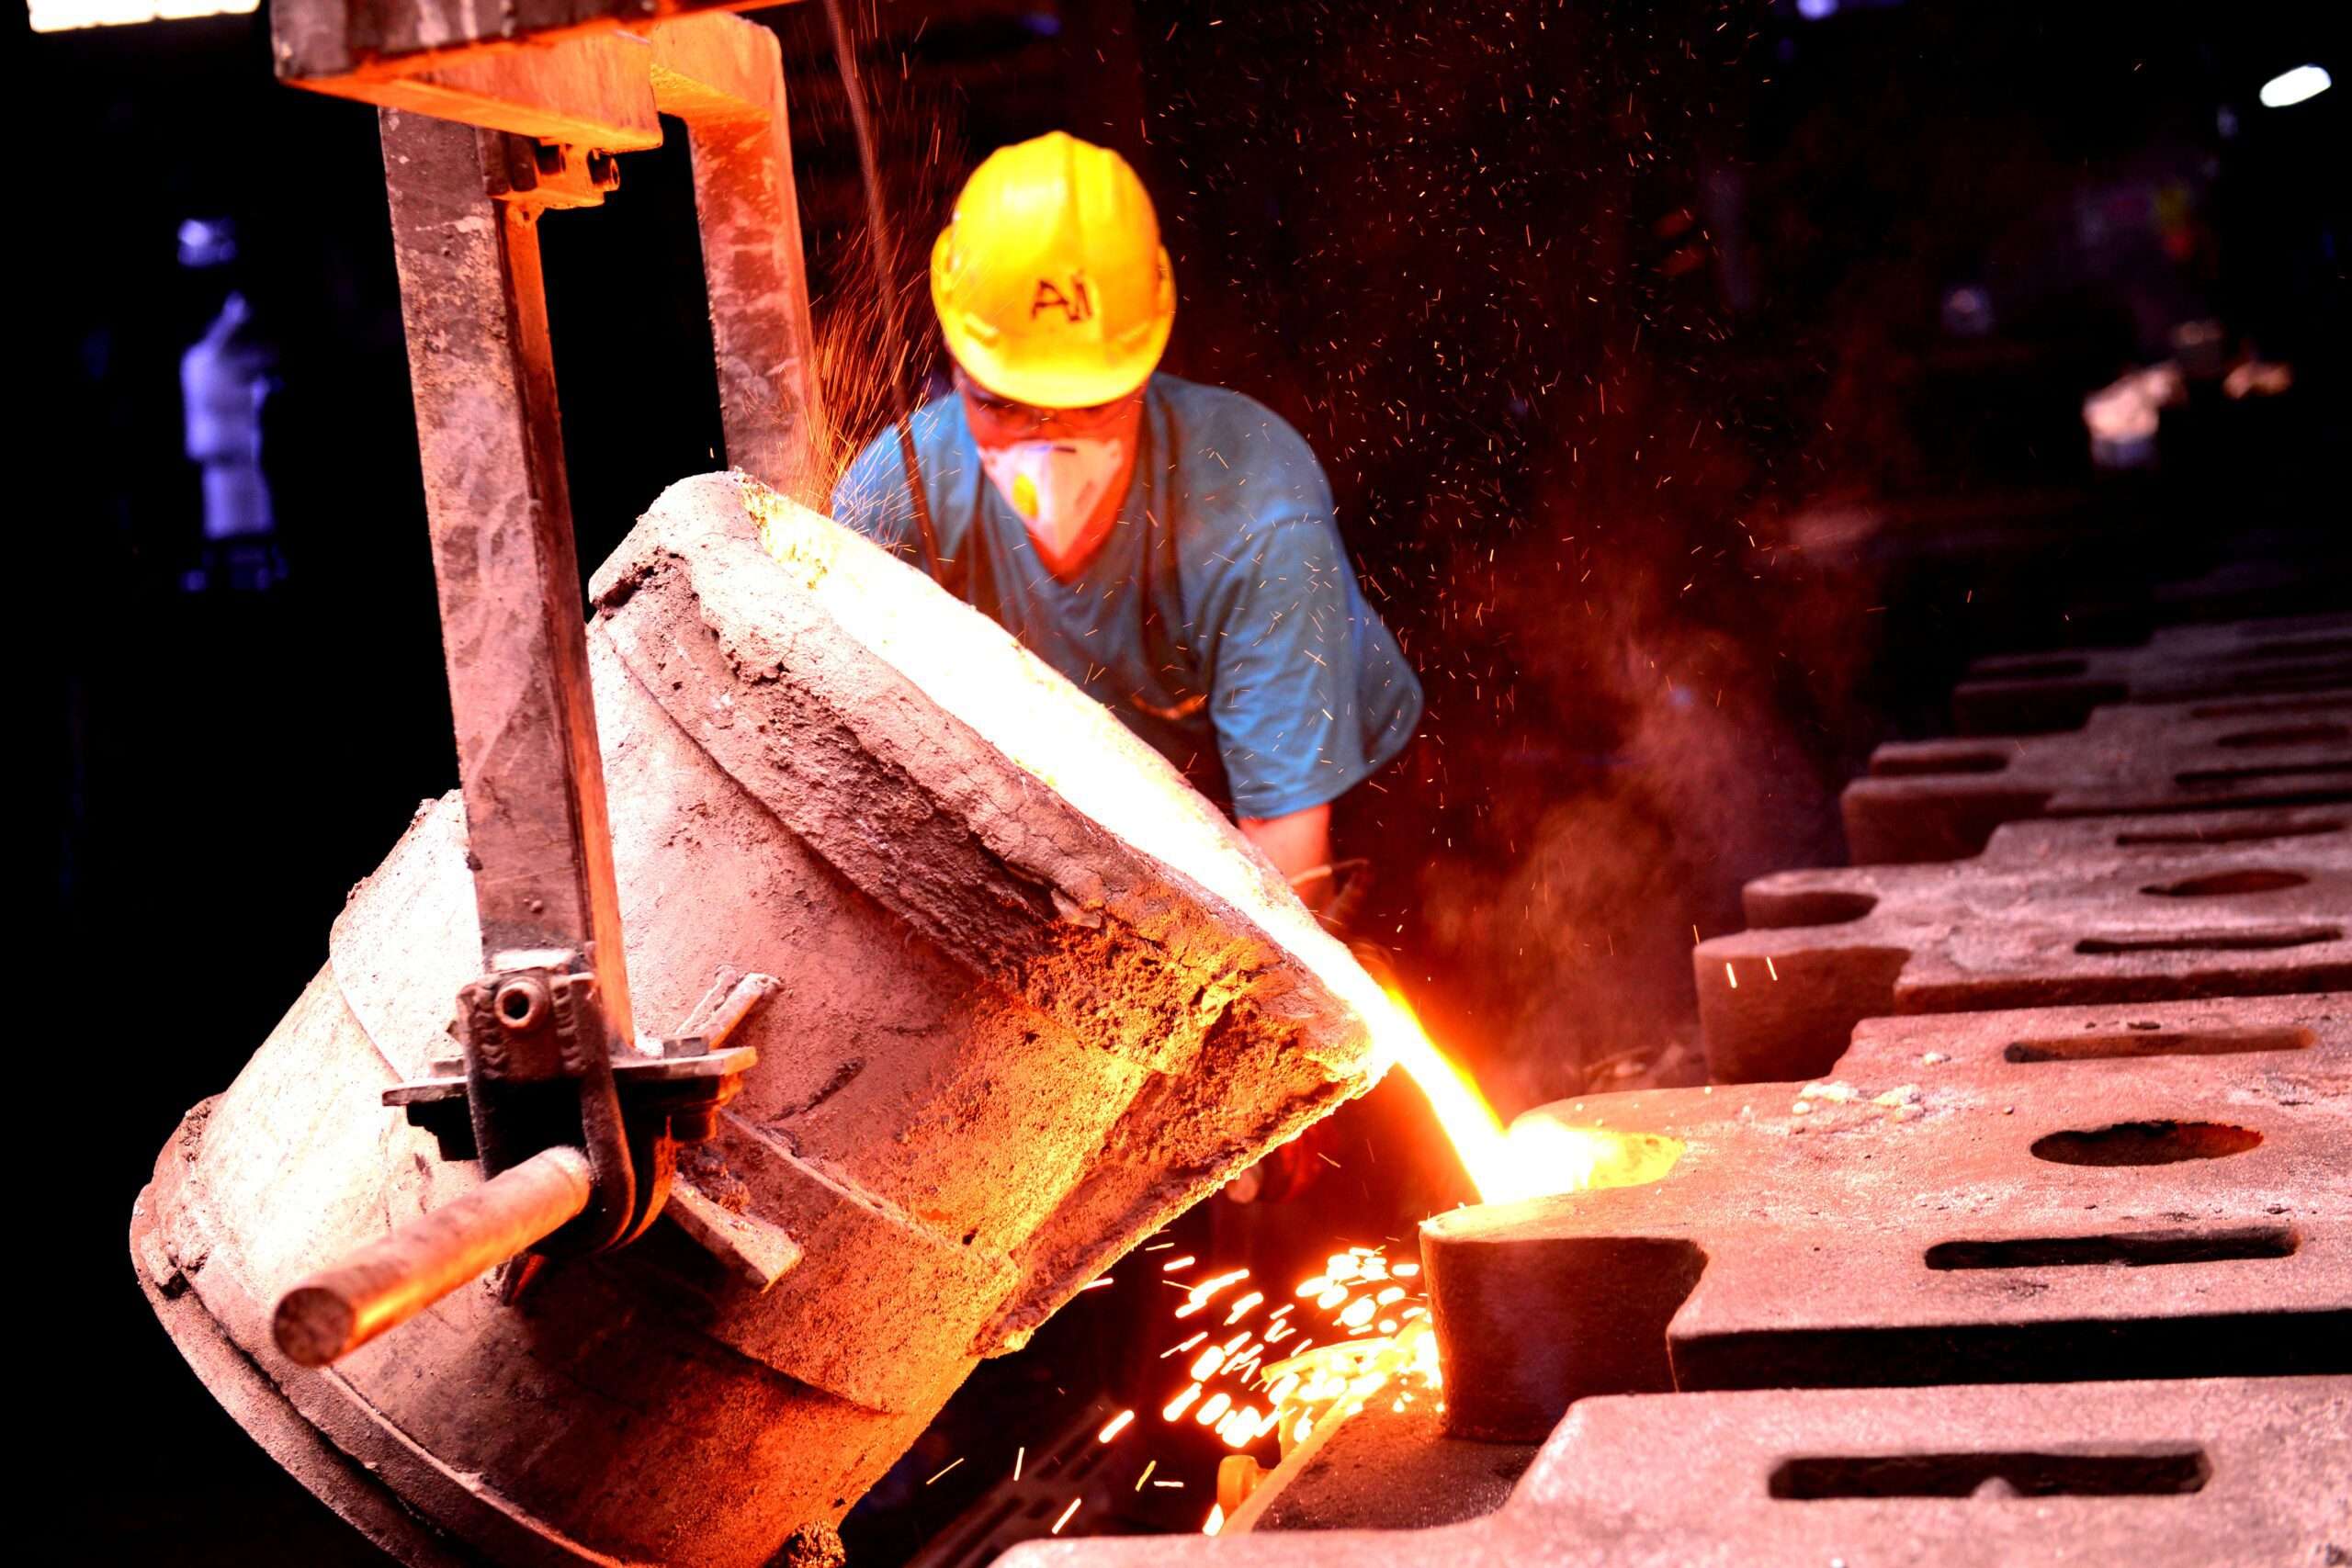
Nava Ltd. traces its roots back to the establishment of Nava Bharat Ventures Ltd. in the early years of the 20th century. The company was founded with a vision to contribute to India’s industrial growth and development. Over the years, it has undergone strategic transformations and rebranding to align with its expanding portfolio and global ambitions. Nava Ltd. operates across diverse business segments, showcasing its versatility and adaptability to changing market trends. The key sectors in which the company operates include Power, Ferro alloys and Mining. The company used to operate sugar plants till 2017, however it as wound up its sugar plants and is now focusing into new ventures like Agriculture and Health care. Other than Bharat the company has well established operations in Zambia, Malaysia and Singapore.
Business Overview:
Nava Ltd. has a rich history of evolution wherein it has never shied away from venturing into now business segments which has allowed the company to have such a varied mix of companies in its portfolio. Another notable element about the company is that it chooses its business segments in a way to augment the operations of its existing business. For example the power plants operated by the company in Bharat are captive power plants i.e these plants provide power primarily to its ferro alloy plants and the excess power is sold outside. This is a kind of backward integration that is seen in other aspects of company operations. Another example, is that the coal for its power plants is provided by its mining business arm and the excess coal is sold in the market. Now the company has started investing in agriculture and is focusing on Avocado plantations in Zambia. Looking at the company’s style of operations soon it will utilise its land of erstwhile sugar plants for this purpose. This along with its foray into healthcare shows its vision of choosing businesses that will last for long time in future.
Company’s Ferro Alloy business is closely linked to the performance of steel industry which in turn is linked to automobile and infrastructure industries. The Government’s thrust on investment into infrastructure has given boost to the company. Some of the key factors that have supported the company are that the Government has brought specialty steel under Product Linked Incentive Scheme and “Atma Nirbhar Bharat Abhiyaan” through which Bharat is trying to reduce its dependence on imports by incentivizing production within the country.
In the power sector the company operates two captive power plants located at Paloncha(Telangana) and Kharagprasad (Odisha) with a total power capacity of 204MW catering to the power needs of entire ferro alloy production. The company is further attempting to convert another 150MW power plant located in Telangana to captive power plant.
The revenue distribution of the company over the period under observation is given below:
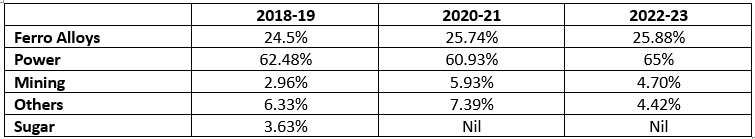
Company has discontinued its operations in the sugar industry since 2019 and is in the process of disposing off the plant and related equipment. The land bank of the sugar plants may be used in future for the expansion of agri business into which the company has recently ventured. Following are the new business segments into which the company has recently ventured:
- Agriculture – Cultivation of high value crops like Avocado. A pilot project is launched in Zambia. Here the company is trying to utilise the expertise of local farming community.
- Power Plant Operation and Maintenance – The company has leveraged its experience in thermal power plant industry to set up a business vertical and capitalize the opportunity in the country. In Bharat currently about 51% electricity requirement is met through thermal power plants which provides a huge local market for the company.
- Healthcare – The company has expanded into healthcare enabled services in Singapore and Malaysia through the acquisition of TIASH Pte. Ltd. that holds the ownership of two specialized healthcare service firms – The Iron Suites and Compai Pharma.
The company’s inherent nature of backward and forward integration of its business supply chain and choice of new businesses instills confidence in future performance of the company.
****************************************************
Financial Ratios
Leverage Ratios
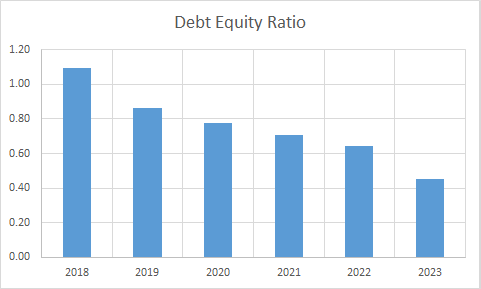
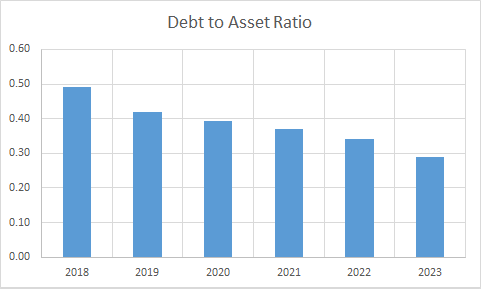
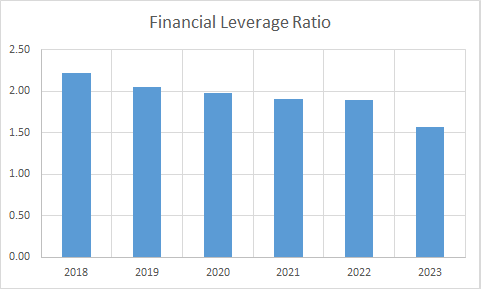
Observations:
- The company has been able to bring down its debt levels. The standalone debt on the company is still smaller and the majority of debt is from Mamba Collieries Ltd., Zambia and was due to non-payment of dues from the government. However, now the company has worked out dues repayment terms with the Zambian Govt. and as a result we see improvement in debt-equity ratio.
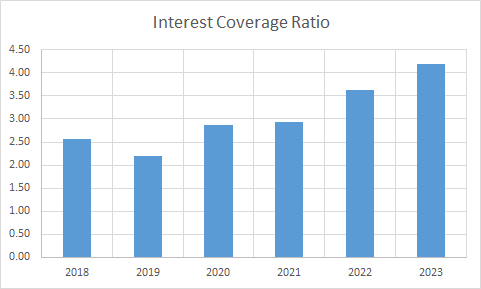
- Throughout the period the company has maintained a healthy Interest coverage ratio.
Operating Ratios
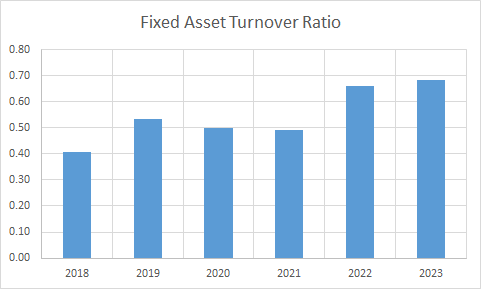
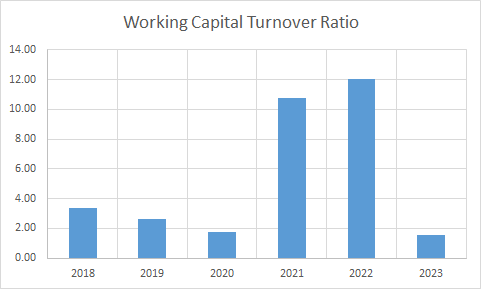
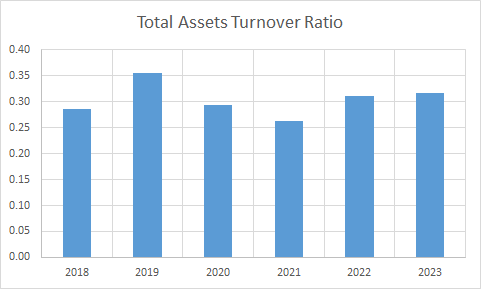
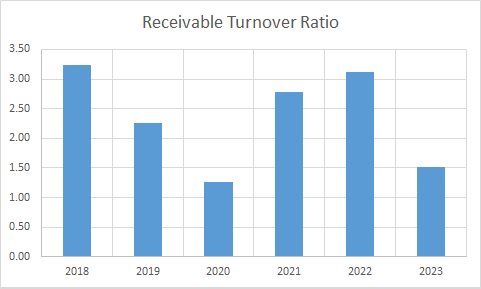
Observations:
- The company has maintained a positive working capital turnover ratio.
- The receivable turnover ratio has seen a slight decline during the period.
Profitability Ratios
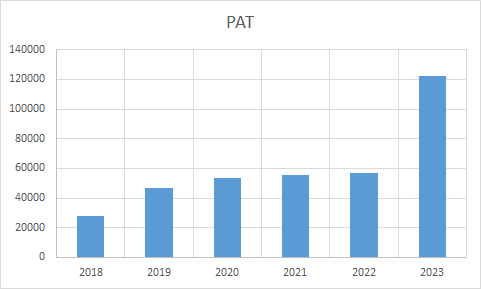
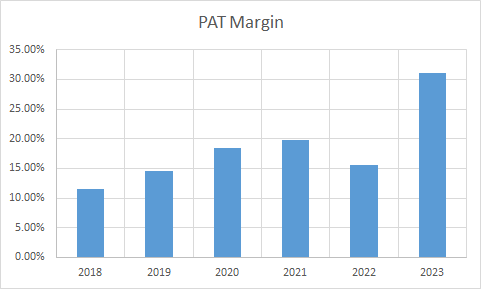
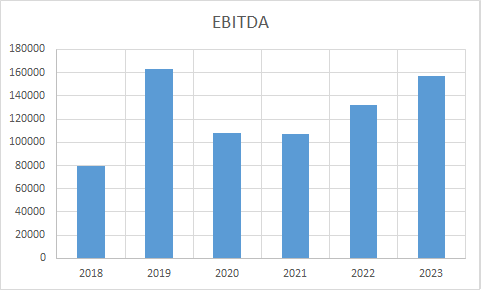
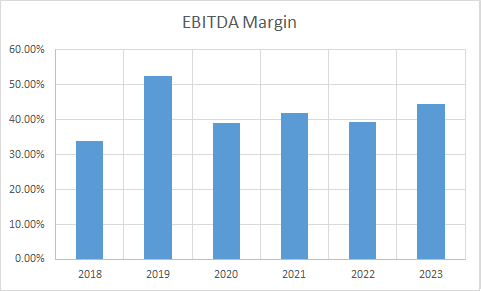
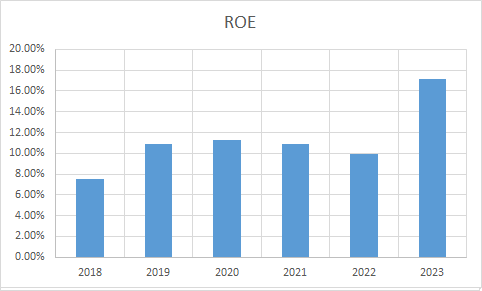
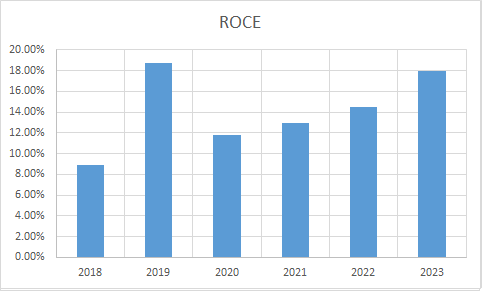
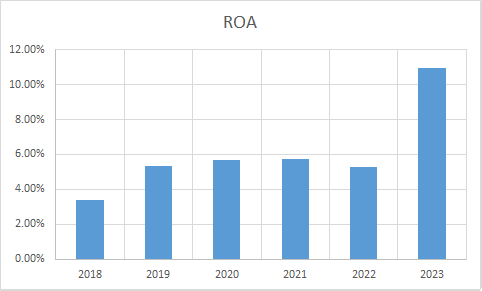
Observations:
- PAT, EBITDA and respective margins have seen improvement during the period.
- ROE, ROCE and ROA all have seen improvement during this period.
****************************************************
Intrinsic Value of Nava Ltd.
Before we enter into the calculation of Intrinsic value of Nava Ltd. we have to make some logical assumptions based on the previous six years financial statements and ongoing yield for 30y Government Of India bonds.
Assumptions:
- Terminal growth rate is assumed to be 0%.
- Weighted Average Cost of Capital(WACC) is assumed to be 12%.
- Free cash flow will be 11% of revenues in future. The FCF/Revenue ratio for the period under consideration has an average of 0.11. We assume that this ratio will hold good for future.
Based on the above assumptions we have arrived at two levels as intrinsic value of the firm. One is based on extrapolation of Free Cash Flow and the other is based on Free cash flows derived from extrapolated values of revenues. Both the methods only differ in how the input values are derived; in both the cases the present value is arrived at using Discounted Cash Flow Method.
Free Cash Flow Growth Model
Intrinsic Value: Rs. 315.40
Stock Entry price with 25% margin of safety: Rs. 236.55
Revenue Growth Model
Intrinsic Value: Rs. 251.29
Stock Entry price with 25% margin of safety: Rs. 188.47. 35.73
The intrinsic values arrived above are not the same since the Free Cash Flow model considers a pessimistic starting base value of present free cash flow for extrapolation whereas the Revenue Growth model takes the actual point on the extrapolation line for the current year. The average of the above two stock entry prices works out to be Rs. 212.51. When the stock starts trading below this price it becomes attractive for long term investment. This value is valid till the next financial year results are published or some major fundamental change takes place in the company.
****************************************************
Author
Jibu Dharmapalan
Fundamental Analyst
Disclaimer:
This article is for educational purpose only. Investment in securities market is subject to market risks. Please consult your Financial Advisor before investing.
If You Like This Content 👇👇👇
Click Here To Join Us on Facebook For Free Live Interactive Discussion And Learning
References:
https://www.bseindia.com/stock-share-price/nava-ltd/nava/513023/financials-annual-reports/
https://www.navalimited.com/financials/
Click Here for Home
FAQs
What is Intrinsic Value?
Ans: When someone invests in an asset, he does so in order to earn money from the business. The investor gets paid over a period of time as long as he is invested in the asset. Now intrinsic value is the present value of all such future cash flows generated by the asset. So logically one should not invest in any asset if the ask price is more than the intrinsic value of the asset.
How is Intrinsic Value of a company calculated?
Ans: For calculating the intrinsic value of a company all its future cash flows are extrapolated based on the past performance of the company, assumptions about the future growth of the company and its terminal value. Once all these are calculated these are brought to the present date based on appropriate discounting rate. The sum of all these gives the intrinsic value of the company. It may be more or less than the market capitalization of the company. If it is more than the market capitalization of the company then the company is said to be undervalued and is a good bet as a long-term investment and vice versa.
How is Intrinsic Value of a share calculated?
Ans: Once intrinsic value of a company is calculated as explained above, it is divided by the total number of outstanding shares of the company. This gives the intrinsic value of a share.
What is Discounted Cash Flow?
Ans: When we have cash flows that are spread over a period of time then Discounted Cash Flow method is used to calculate present value of all such cash flows. The present value depends on the discounting rate used. Usually 10 year Government bond yield rate(risk free rate of return) is used as the discounting rate.

")
")
")
")
")
")