")
")
")
")
")
")
")
")
")
")

Fundamental Analysis And Intrinsic Value Of Godrej Industries Ltd. (2023-24)
In this article we will try to analyze Godrej Industries Ltd. based on previous six years of financial statements viz Balance sheet, Profit and Loss statement and Cash flow statement. With this fundamental analysis we will try to gain insight into the business activities, financial health, operating efficiency and profitability of the company and finally try to derive the intrinsic value of the stock using Discounted Cash Flow method and the price at which the stock becomes attractive for long term investment. This article is divided in three sections as listed below :-
Section 1: Qualitative Fundamental Analysis comprising of General Introduction, Business overview dwelling into Business Model, Strengths and Weakness, Long Term Sustainability and finally the competitors.
Section 2:Quantitative Fundamental Analysis on Financial Health, Operating Efficiency And Profitability.
Section 3: Calculation Of Intrinsic Value.
General Introduction
Dated: 30 Dec 23
Company: Godrej Industries Ltd.
CMP: Rs. 744.90
Market Capitalisation: Rs. 25,080.04 Cr.
Share Holding Pattern:
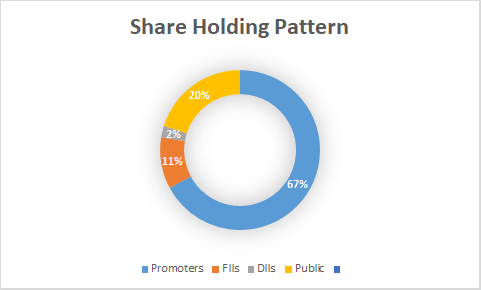
Promoters: Adi Godrej, Nadir Godrej, Jamshyd Godrej, Tanya Dubash, Pirojsha Godrej
Top Five Competitors: DLF, Oberoi Realty, Prestige Estates, HUL, Emami, Dabur India, Avanti Feeds, KSE, SRF, Tata Chemicals, Deepak Nitrite
Fundamental Analysis Of Godrej Industries Ltd.
General Introduction:
Godrej Industries Ltd., established in 1897, has transcended its humble beginnings as a lock manufacturer to become a diversified behemoth spanning everything from real estate and appliances to agriculture and financial services.
Over the decades, Godrej Industries Ltd. has strategically expanded into a multitude of sectors, each driven by a relentless focus on innovation and sustainability. Godrej Consumer Products, with its iconic Cinthol soap and Hit insecticide, is a household staple across emerging markets. Godrej Properties, synonymous with luxury apartments and green buildings, has reshaped India’s skylines.
Beyond commercial success, Godrej Industries Ltd. is deeply embedded in India’s social fabric. Its “Good & Green” strategy prioritizes environmental and social responsibility, evident in initiatives like sustainable sourcing and community development programs. With a global footprint spanning over 90 countries and 1.2 billion consumers, Godrej’s story is far from over.
Business Overview:
Godrej Industries Ltd. is the holding company of Godrej Group and has the following subsidiaries
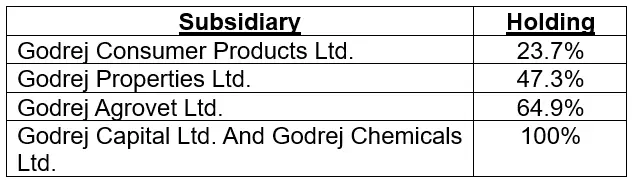
We have discussed all subsidiaries separately except Godrej Capital and Godrej Chemicals. You can check the links below to check these subsidiaries individually –
The heart of Godrej Industries Ltd. (GIL) beats with its Chemicals division, a major contributor to the company’s revenue. This division boasts a diverse portfolio, with:
- Fatty acids (40% revenue share) serving as essential building blocks for soaps, detergents, and personal care products.
- Fatty alcohols (30% revenue share) adding smoothness and texture to cosmetics and pharmaceuticals.
- Surfactants (23% revenue share) providing cleaning power in household products and industrial applications.
- Glycerin (7% revenue share) adding a touch of sweetness and moisture to food and beverages.
These chemicals are closely linked to the FMCG sector, as their demand rises and falls with the popularity of their end products.
GIL also ventures into the world of edible oils, producing rice bran, sunflower, sesame, and groundnut oils. These cater primarily to the Hotel, Restaurant, and Catering (HORECA) segment, adding another layer of diversity to the company’s offerings.
Godrej Capital Ltd. (GCL), a subsidiary of GIL, flexes its financial muscle through its holdings in Godrej Housing Finance Ltd. (GHFL) and Godrej Finance Ltd. (GFL). As of March 2023, GHFL boasts Assets Under Management (AUM) of Rs. 3,800 crore, while GFL manages Rs. 1,300 crore. Both companies have shown impressive growth in recent years, solidifying GCL’s position as a financial powerhouse.
With its diverse and growing businesses, GIL paints a promising picture for the future. The Chemicals division remains a key driver, while the success of GCL and its subsidiaries adds another layer of stability and growth potential. This combination of established strengths and emerging opportunities positions GIL as a leading force in the Indian market, ready to face the future with confidence. However, one has to be cautious as the debt levels are high in the company.
****************************************************
Financial Ratios
Leverage Ratios
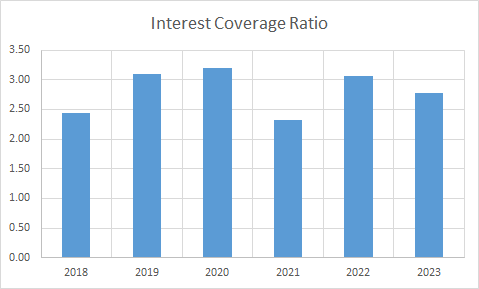
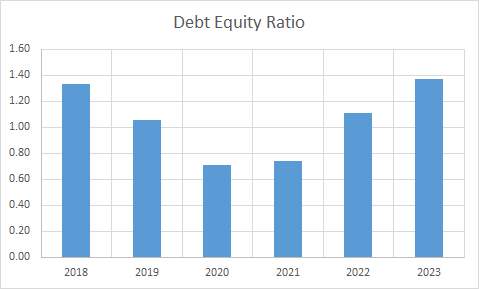
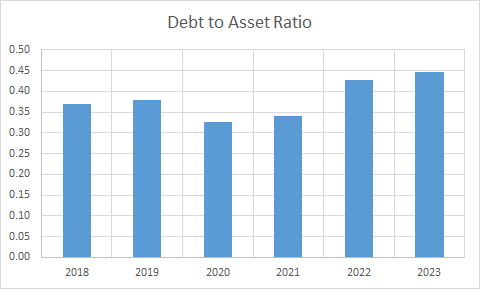
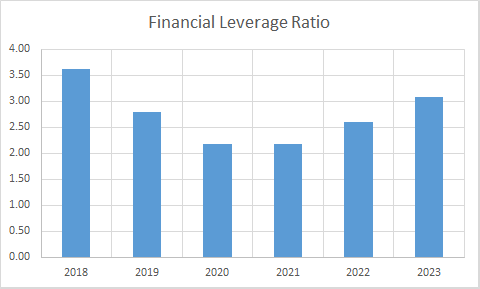
Observations:
- The company is operating with high levels of debt. On standalone basis the D/E ratio is at even more dangerous levels. Since the debt is under manageable levels at GAL, GCPL and GPL the main contributors to this are the wholly owned subsidiaries of the company.
Operating Ratios
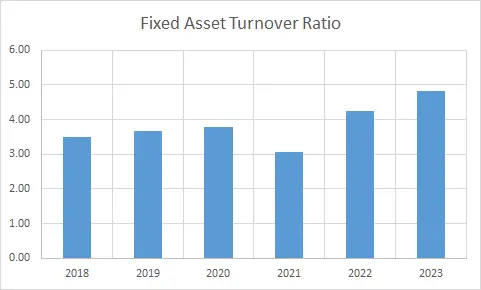
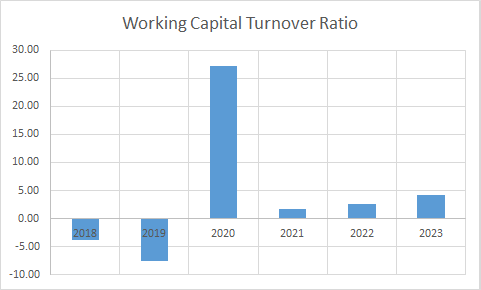
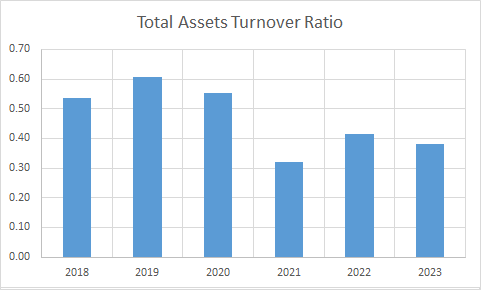
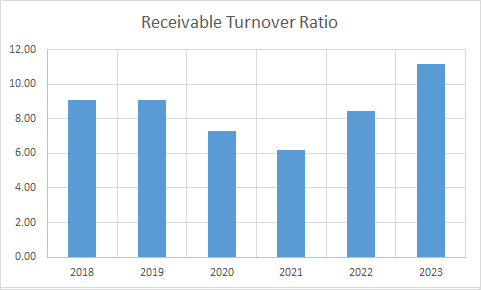
Observations:
- Company has managed to turn working capital positive.
- There is not much improvement in operating ratios of the company during the period.
Profitability Ratios
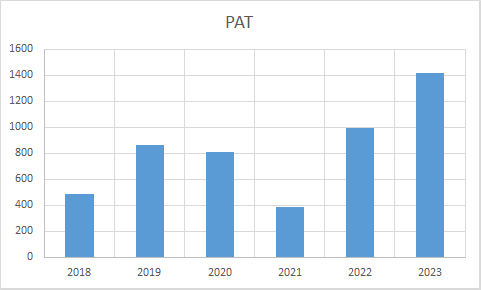
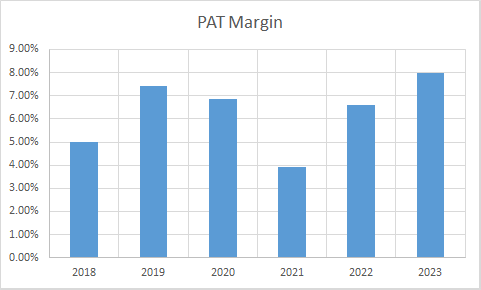
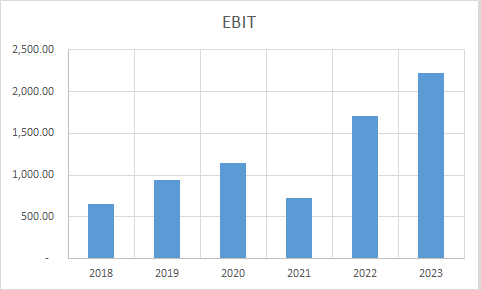
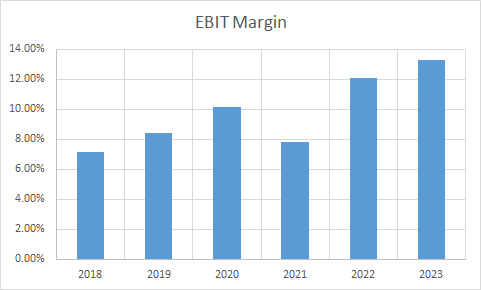
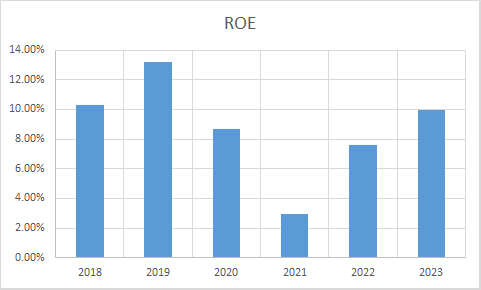
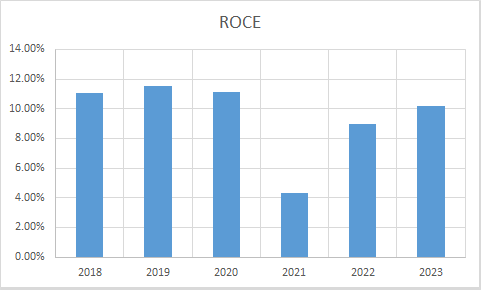
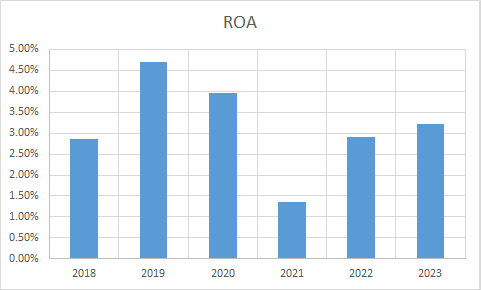
Observations:
- The PAT Margins have improved during this period.
- 2. ROE and ROA have remained almost stable however, ROCE has declined as operating profit has not grown commensurate with debt.
****************************************************
Intrinsic Value of Godrej Industries Ltd.
Before we enter into the calculation of Intrinsic value of Godrej Industries Ltd. we have to make some logical assumptions based on the previous six years financial statements and ongoing yield for 30y Government Of India bonds.
Assumptions:
- Terminal growth rate is assumed to be 0%.
- Weighted Average Cost of Capital(WACC) is assumed to be 12%.
It was not possible to arrive at realistic Intrinsic valuation for the company based on revenue or Free cash Flow to Firm and hence growth rate of shareholder’s equity is taken as a basis for calculation of Intrinsic value of the firm. Since the liquidation value of a firm may be much lower than shareholder’s equity an appropriate margin of safety is employed in the calculation.
In addition to this, the Intrinsic value of the company is also calculated using the Sum of Parts Method where the sum total of the weighted intrinsic values of the subsidiaries is added to arrive at the intrinsic value of the parent company.
Shareholder’s Equity Growth Model
Intrinsic Value: Rs. 357.39
Stock Entry price with 25% margin of safety: Rs. 268.04
Sum Of Parts Method
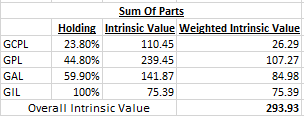
Intrinsic Value: Rs. 391.90
Stock Entry price with 25% margin of safety: Rs. 293.93
The average of the above two stock entry prices works out to be Rs. 280.98. When the stock starts trading below this price it becomes attractive for long term investment. This value is valid till the next financial year results are published or some major fundamental change takes place in the company.
****************************************************
Author
Jibu Dharmapalan
Fundamental Analyst
Disclaimer:
This article is for educational purpose only. Investment in securities market is subject to market risks. Please consult your Financial Advisor before investing.
If You Like This Content 👇👇👇
Click Here To Join Us on Facebook For Free Live Interactive Discussion And Learning
References:
https://www.godrejindustries.com/investors/annual-reports
Click Here for Home
FAQs
What is Intrinsic Value?
Ans: When someone invests in an asset, he does so in order to earn money from the business. The investor gets paid over a period of time as long as he is invested in the asset. Now intrinsic value is the present value of all such future cash flows generated by the asset. So logically one should not invest in any asset if the ask price is more than the intrinsic value of the asset.
How is Intrinsic Value of a company calculated?
Ans: For calculating the intrinsic value of a company all its future cash flows are extrapolated based on the past performance of the company, assumptions about the future growth of the company and its terminal value. Once all these are calculated these are brought to the present date based on appropriate discounting rate. The sum of all these gives the intrinsic value of the company. It may be more or less than the market capitalization of the company. If it is more than the market capitalization of the company then the company is said to be undervalued and is a good bet as a long-term investment and vice versa.
How is Intrinsic Value of a share calculated?
Ans: Once intrinsic value of a company is calculated as explained above, it is divided by the total number of outstanding shares of the company. This gives the intrinsic value of a share.
What is Discounted Cash Flow?
Ans: When we have cash flows that are spread over a period of time then Discounted Cash Flow method is used to calculate present value of all such cash flows. The present value depends on the discounting rate used. Usually 10 year Government bond yield rate(risk free rate of return) is used as the discounting rate.


")
")
")
(Modified)")
")
")