
")
")
")
")
")
")
")
")
")
")

Fundamental Analysis And Intrinsic Value Of Tech Mahindra Ltd.(2023-24)
In this article we will try to analyze Tech Mahindra Ltd. based on previous six years of financial statements viz Balance sheet, Profit and Loss statement and Cash flow statement. With this fundamental analysis we will try to gain insight into the business activities, financial health, operating efficiency and profitability of the company and finally try to derive the intrinsic value of the stock using Discounted Cash Flow method and the price at which the stock becomes attractive for long term investment. This article is divided in three sections as listed below :-
Section 1: Qualitative Fundamental Analysis comprising of General Introduction, Business overview dwelling into Business Model, Strengths and Weakness, Long Term Sustainability and finally the competitors.
Section 2:Quantitative Fundamental Analysis on Financial Health, Operating Efficiency And Profitability.
Section 3: Calculation Of Intrinsic Value.
General Introduction
Dated: 07 Jan 24
Company: Tech Mahindra Ltd.
CMP: Rs. 1249.05
Market Capitalisation: Rs. 1,21,927.81 Cr.
Share Holding Pattern:
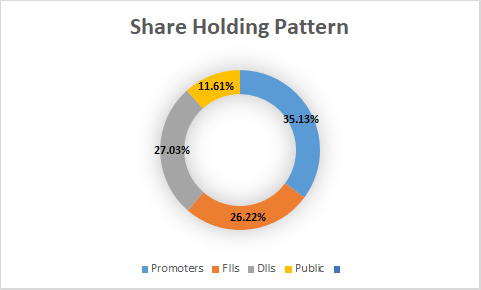
Promoters: Government Of India
Top Five Competitors: NTPC Ltd., Power Grid Corporation Of India, Adani Power Ltd., Adani Green Ltd., Tata Power Ltd.
Fundamental Analysis Of Tech Mahindra Ltd.
General Introduction:
Tech Mahindra Ltd. was established as a subsidiary of the Mahindra Group in 1986. The company’s comprehensive suite of services encompasses consulting, digital transformation, network services, and business process outsourcing. This integrated approach positions Tech Mahindra as a strategic partner for businesses seeking not just solutions, but holistic and future-ready transformations.
One of the company’s key strengths lies in its global footprint, with a presence in over 90 countries and a diverse workforce representing various cultures and talents. This international reach enables Tech Mahindra to tailor its services to local nuances while leveraging a global pool of expertise to stay at the forefront of industry trends.
In an era where digital disruption is the norm, Tech Mahindra remains ahead of the curve by investing heavily in emerging technologies. The company’s innovation labs are hotbeds of creativity, fostering the development of solutions in areas such as artificial intelligence, blockchain, the Internet of Things (IoT), and 5G.
Business Overview:
Tech Mahindra Ltd is a part of Mahindra Group which is a globally recognized conglomerate having presence in more than 100 countries. It provides comprehensive range of IT services, including IT enabled service, application development and maintenance, consulting and enterprise business solutions, etc. to a diversified base of corporate customers in a wide range of industries.
The company offers a wide range of services e.g. infrastructure & cloud services, engineering services, application services, data analytics, network services, testing services, performance engineering, Security & risk management services, business process services, product engineering, consulting, etc. The company has a global presence with more than 1,50,000 employees across 90 countries and is among the top six IT companies in Bharat.
The breakdown of revenue of the company is as given below:
Based on Geography
| 2018-19 | 2020-21 | 2022-23 | |
| America | 47% | 47.5% | 50% |
| Europe | 29% | 26% | 25% |
| Rest | 24% | 26.5% | 25% |
Based on verticals served
| 2018-19 | 2020-21 | 2022-23 | |
| Communication | 41% | 39.7% | 40% |
| Manufacturing | 20% | 16.4% | 15.72% |
| Tech & Media | 7% | 9.4% | 10.09% |
| Banking, Financial Services & Insurance | 13% | 16.2% | 16.18% |
| Retail, Transport & Logistics | 7% | 7.6% | 8.01% |
| Others | 12% | 10.9% | 10% |
It is evident that like most other Indian IT companies there is heavy dependence on revenue from America. One of the reasons for this is that in smaller markets like Africa and East Asia there are local players who may have cost advantage over TechM. However, the company has been present in these markets during the period of heavy turmoil and has learned to survive such times and has gradually improved its client base from 938 in 2019 to 1007 in 2021 to 1297 in 2023.
In verticals the main source of revenue is from communication sector which accounts for about 40% of the contribution. Communication companies are undergoing a paradigm shift from being mere people to people telecommunication business to intelligent networking companies facilitating people to people, people to machines, machines to people and machines to machines communication with the advent of 5G enabled IOT, VR/AR and AI. TechM is at the forefront to be a part of the evolving technology.
In addition to the present-day technology the company has taken strides in following evolving technologies
Blockchain: The company has identified and is working on a holistic framework called ‘Block Ecosystem’ which creates industry leading applications that are architected on innovation and human excellence to unlock significant value for the stackeholders.
Augmented Reality/ Virtual Reality: The company has identified the scope of AR/VR as an important component of future tech and has given due impetus towards the same.
Artificial Intelligence & Machine Learning: The company is actively engaged in a comprehensive research initiative aimed at unraveling the intricacies of brain functionality, specifically focusing on the realms of thought processes and memory functions. The overarching objective is to devise an innovative algorithm capable of operating with reduced data requirements while attaining a fundamental comprehension of actions and insights. This pursuit signifies a commitment to developing advanced computational models that emulate primal cognitive processes, paving the way for more efficient and nuanced artificial intelligence applications.
Quantum Computing: TechM recognizes quantum computing as the next big leap in technology and has joined hands with other pioneers and institutes in the field. The combination of AI/ML, Blockchain technology and quantum computing can enable companies to solve complex classical optimization problems.
With extensive cross-industry expertise in developed and developing economies across economic life cycles, coupled with a fervent commitment to upskilling with emerging technologies, the company is poised to endure the challenges of the future. This robust foundation, built on diverse experiences and a proactive approach to technological advancements, ensures the company’s resilience and adaptability. It is well-equipped to navigate evolving landscapes, demonstrating a steadfast resolve to thrive in an ever-changing business environment, making it a force that stands the test of time.
****************************************************
Financial Ratios
Leverage Ratios
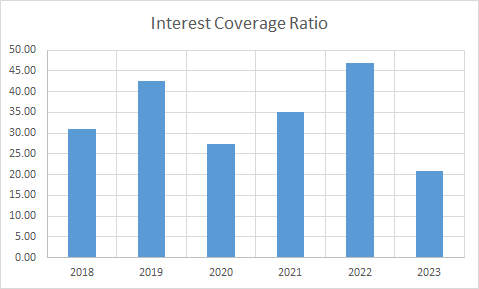
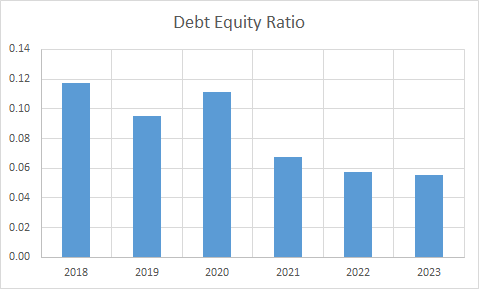
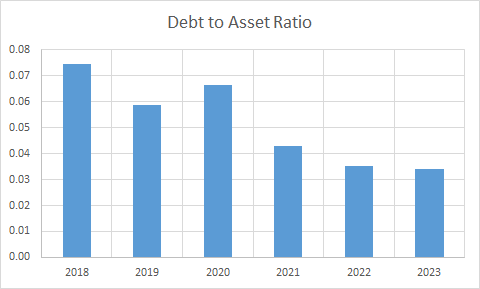
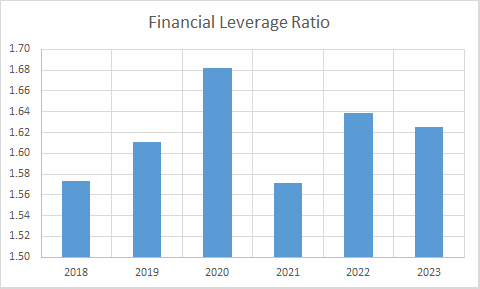
Observations:
- The company is operating with very low debt levels and has a healthy interest coverage ratio.
Operating Ratios
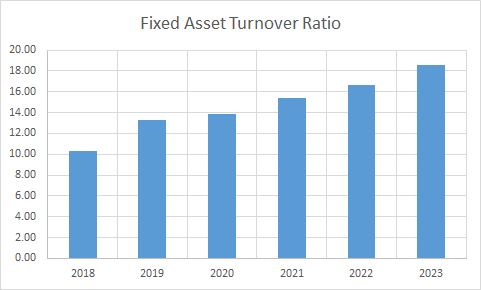
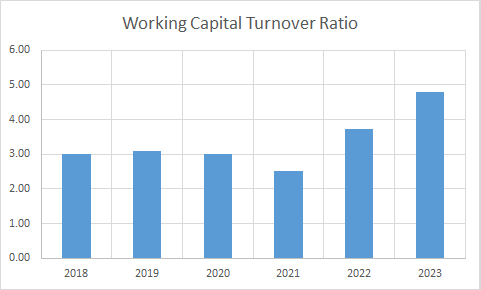
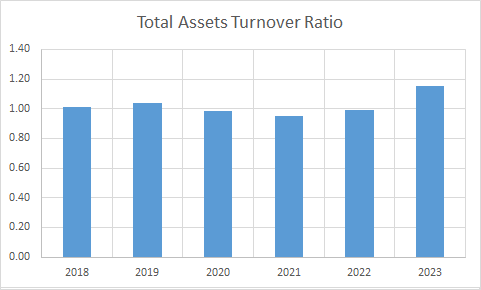
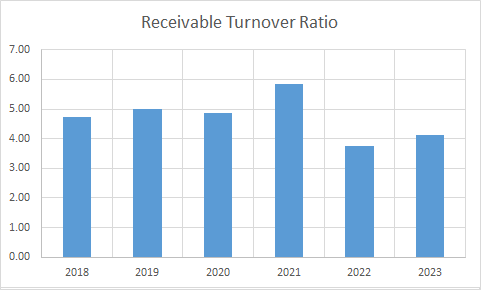
Observations:
- The company has maintained a positive working capital turnover ratio.
- Receivable turnover ratio has remained stable during the period.
Profitability Ratios
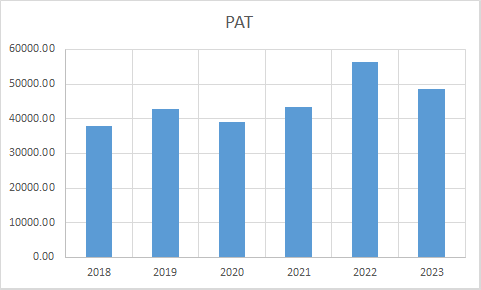
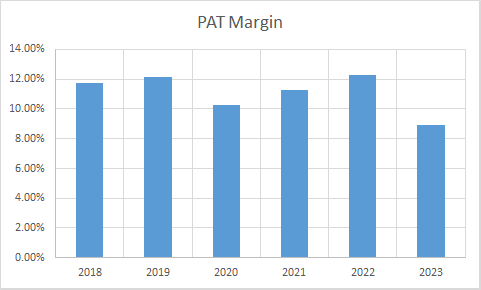
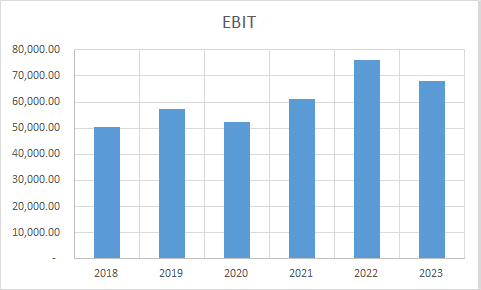
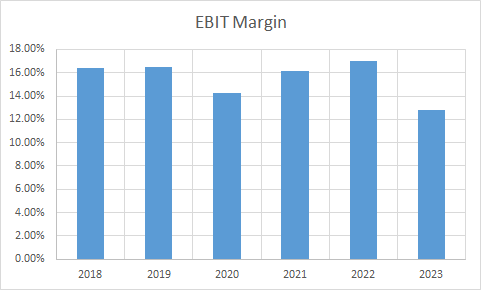
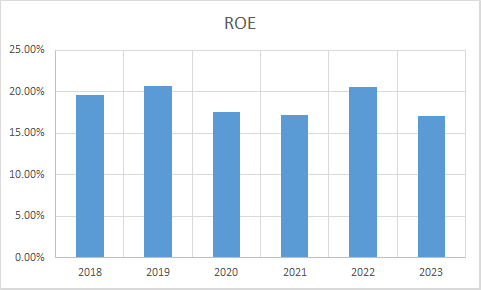
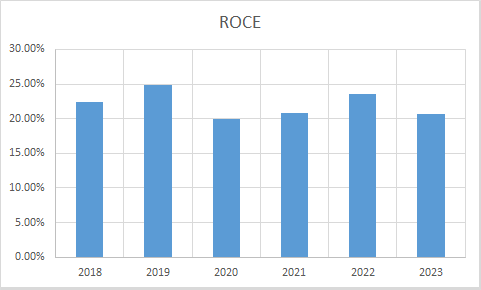
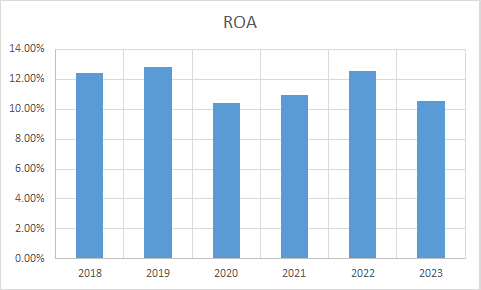
Observations:
- PAT has grown rather slowly, however PAT margins appear to be stable for most of the period.
- ROE, ROCE and ROA appear to be stable during the period.
****************************************************
Intrinsic Value of Tech Mahindra Ltd.
Before we enter into the calculation of Intrinsic value of Tech Mahindra Ltd. we have to make some logical assumptions based on the previous six years financial statements and ongoing yield for 30y Government Of India bonds.
Assumptions:
- Terminal growth rate is assumed to be 0%.
- Weighted Average Cost of Capital(WACC) is assumed to be 12%.
- Free cash flow will be 10% of revenues in future. The FCF/Revenue ratio for the period under consideration has an average of 0.10. We assume that this ratio will hold good for future.
Based on the above assumptions we have arrived at two levels as intrinsic value of the firm. One is based on extrapolation of Free Cash Flow and the other is based on Free cash flows derived from extrapolated values of revenues. Both the methods only differ in how the input values are derived; in both the cases the present value is arrived at using Discounted Cash Flow Method.
Free Cash Flow Growth Model
Intrinsic Value: Rs. 327.92
Stock Entry price with 25% margin of safety: Rs. 245.94
Revenue Growth Model
Intrinsic Value: Rs. 522.86
Stock Entry price with 25% margin of safety: Rs. 392.15
The intrinsic values arrived above are not the same since the Free Cash Flow model considers a pessimistic starting base value of present free cash flow for extrapolation whereas the Revenue Growth model takes the actual point on the extrapolation line for the current year. The average of the above two stock entry prices works out to be Rs. 319.04. When the stock starts trading below this price it becomes attractive for long term investment. This value is valid till the next financial year results are published or some major fundamental change takes place in the company.
****************************************************
Author
Jibu Dharmapalan
Fundamental Analyst
Disclaimer:
This article is for educational purpose only. Investment in securities market is subject to market risks. Please consult your Financial Advisor before investing.
If You Like This Content 👇👇👇
Click Here To Join Us on Facebook For Free Live Interactive Discussion And Learning
References:
https://www.bseindia.com/stock-share-price/tech-mahindra-ltd/techm/532755/financials-annual-reports/
https://www.techmahindra.com/en-in/investors/
Click Here for Home
FAQs
What is Intrinsic Value?
Ans: When someone invests in an asset, he does so in order to earn money from the business. The investor gets paid over a period of time as long as he is invested in the asset. Now intrinsic value is the present value of all such future cash flows generated by the asset. So logically one should not invest in any asset if the ask price is more than the intrinsic value of the asset.
How is Intrinsic Value of a company calculated?
Ans: For calculating the intrinsic value of a company all its future cash flows are extrapolated based on the past performance of the company, assumptions about the future growth of the company and its terminal value. Once all these are calculated these are brought to the present date based on appropriate discounting rate. The sum of all these gives the intrinsic value of the company. It may be more or less than the market capitalization of the company. If it is more than the market capitalization of the company then the company is said to be undervalued and is a good bet as a long-term investment and vice versa.
How is Intrinsic Value of a share calculated?
Ans: Once intrinsic value of a company is calculated as explained above, it is divided by the total number of outstanding shares of the company. This gives the intrinsic value of a share.
What is Discounted Cash Flow?
Ans: When we have cash flows that are spread over a period of time then Discounted Cash Flow method is used to calculate present value of all such cash flows. The present value depends on the discounting rate used. Usually 10 year Government bond yield rate(risk free rate of return) is used as the discounting rate.


")
")
")
")
")
")