Fundamental Analysis And Intrinsic Value Of Indian Metals And Ferro Alloys Ltd.(2023-24)
In this article we will try to analyze Indian Metals And Ferro Alloys Ltd. based on previous six years of financial statements viz Balance sheet, Profit and Loss statement and Cash flow statement. With this fundamental analysis we will try to gain insight into the business activities, financial health, operating efficiency and profitability of the company and finally try to derive the intrinsic value of the stock using Discounted Cash Flow method and the price at which the stock becomes attractive for long term investment. This article is divided in three sections as listed below :-
Section 1: Qualitative Fundamental Analysis comprising of General Introduction, Business overview dwelling into Business Model, Strengths and Weakness, Long Term Sustainability and finally the competitors.
Section 2:Quantitative Fundamental Analysis on Financial Health, Operating Efficiency And Profitability.
Section 3: Calculation Of Intrinsic Value.
General Introduction
Dated: 10 Jan 24
Company: Indian Metals And Ferro Alloys Ltd.
CMP: Rs. 499.45
Market Capitalisation: Rs. 2694.74 Cr.
Share Holding Pattern:
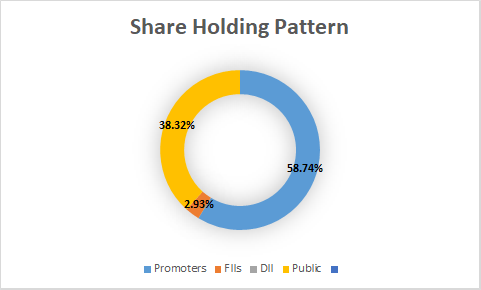
Promoters: Bijayant Panda, Subhrakant Panda, Mrs. Paramita Mahapatra
Top Five Competitors: Maithan Alloys, Indian Metals
Fundamental Analysis Of Indian Metals And Ferro Alloys Ltd.
General Introduction:
Indian Metals & Ferro Alloys Limited (IMFA) is the country’s leading, fully integrated ferro alloys manufacturer. The Company’s unwavering commitment to innovation, quality, and sustainable development in manufacturing processes has positioned it as one of the most reliable and efficient ferro chrome producers worldwide. IMFA’s focus on quality has earned it a sterling reputation, and the company’s emphasis on sustainability has ensured that its manufacturing processes have minimal impact on the environment. Its global presence has allowed it to establish long-term relationships with its customers, who rely on the company’s ability to deliver high quality ferro alloys in a timely and cost-effective manner. All these factors have contributed to IMFA’s impressive growth and success over the years.
IMFA’s business philosophy emphasizes the development of self-sufficiency within its system, which has resulted in the implementation of integrated operations. The company has established two captive mines, located in Sukinda and Mahagiri in Jajpur, Odisha, as well as the capacity for thermal and solar power generation.
Business Overview:
In the landscape of the global steel industry, Ferro chrome plays a pivotal role, serving as a key ingredient in the production of special and carbon steel. Essential for the creation of stainless steel, Ferro chrome not only imparts corrosion resistance but also adds strength and luster, making it a unique product with multifaceted applications. Indian Metals and Ferro Alloys Ltd. (IMFA) stands as a significant player in this industry, contributing to both the domestic and international markets.
IMFA’s prominence in the ferrochrome sector stems from its strategic chrome mines in Sukinda and Mahagiri, located in Jajpur, Odisha. These mines provide the raw material essential for the production of ferrochrome. Furthermore, the company has invested in captive power plants, ensuring a reliable and uninterrupted supply of electricity. As of 2023, IMFA’s captive power plants are capable of generating 200MW of electricity, demonstrating the company’s commitment to self-sufficiency.
With approximately 18% of domestic ferrochrome production under its belt, IMFA has established itself as a key contributor to India’s metallurgical landscape. The company’s success is rooted in its ability to meet the growing demand for ferrochrome, particularly driven by the steel industry.
The main producers of ferrochrome globally include China, South Africa, Kazakhstan, and Bharat (India). IMFA’s geographical advantage with its chrome mines in Odisha positions it strategically in the global supply chain. While China dominates ferrochrome production, its heavy reliance on chrome ore imports from South Africa sets a production cost floor for other countries, creating a dynamic that IMFA navigates adeptly.
The shift in the global ferrochrome landscape has been influenced by factors such as increased electricity tariffs in South Africa, the previous industry leader boasting the world’s largest chrome ore reserves. This change has altered the competitive dynamics, providing opportunities for other players like IMFA to gain prominence.
IMFA’s reach extends beyond borders, with approximately 90% of its output being exported to the Far East, the epicenter of global steel production. Notable customers include major steel players like POSCO (South Korea), Marubeni (Japan), Nisshin Steel (Japan), and domestic giants like Jindal Steel and AIA Engineering. This diverse customer base reflects IMFA’s ability to cater to the specific needs of a global clientele.
Despite its promising position, the ferro-chrome industry faces challenges that necessitate careful navigation. Government regulations, the cost of electricity, and sociopolitical factors all pose significant hurdles. Adapting to these challenges while maintaining operational efficiency is crucial for sustained growth in this competitive industry.
The growth of the ferro-chrome industry remains intricately linked with the demand for steel. Government initiatives like infrastructure development and the establishment of industrial corridors and smart cities further reinforce this demand. Leveraging its own chrome mines and captive power plants Indian Metals and Ferro Alloys Ltd. is likely to contribute significantly to both domestic and international markets in foreseeable future.
****************************************************
Financial Ratios
Leverage Ratios


Observations:
- Company has managed to bring down its debt and is maintaining a good interest coverage ratio. In absolute terms also the debt has reduced to more than half during this period.
Operating Ratios


Observations:
- Company has maintained a positive working capital except year 2020.
- Receivable turnover ratio has improved slightly.
Profitability Ratios


Observations:
- The company faced two lossmaking years however it still had a positive operating profit for the same years.
- ROE, ROCE And ROA have been very volatile during this period.
****************************************************
Intrinsic Value of Indian Metals And Ferro Alloys Ltd.
Before we enter into the calculation of Intrinsic value of Indian Metals And Ferro Alloys Ltd. we have to make some logical assumptions based on the previous six years financial statements and ongoing yield for 30y Government Of India bonds.
Assumptions:
- Terminal growth rate is assumed to be 0%.
- Weighted Average Cost of Capital(WACC) is assumed to be 12%.
- Free cash flow will be 8% of revenues in future. The FCF/Revenue ratio for the period under consideration has an average of 0.08. We assume that this ratio will hold good for future.
Based on the above assumptions we have arrived at two levels as intrinsic value of the firm. One is based on extrapolation of Free Cash Flow and the other is based on Free cash flows derived from extrapolated values of revenues. Both the methods only differ in how the input values are derived; in both the cases the present value is arrived at using Discounted Cash Flow Method.
Free Cash Flow Growth Model
Intrinsic Value: Rs. 167.91
Stock Entry price with 25% margin of safety: Rs. 125.94
Revenue Growth Model
Intrinsic Value: Rs. 385.67
Stock Entry price with 25% margin of safety: Rs. 289.25
The intrinsic values arrived above are not the same since the Free Cash Flow model considers a pessimistic starting base value of present free cash flow for extrapolation whereas the Revenue Growth model takes the actual point on the extrapolation line for the current year. The average of the above two stock entry prices works out to be Rs. 207.59. When the stock starts trading below this price it becomes attractive for long term investment. This value is valid till the next financial year results are published or some major fundamental change takes place in the company.
****************************************************
Author
Jibu Dharmapalan
Fundamental Analyst
Disclaimer:
This article is for educational purpose only. Investment in securities market is subject to market risks. Please consult your Financial Advisor before investing.
If You Like This Content 👇👇👇
Click Here To Join Us on Facebook For Free Live Interactive Discussion And Learning
References:
https://www.bseindia.com/stock-share-price/indian-metals–ferro-alloys-ltd/imfa/533047/financials-annual-reports/
http://www.imfa.in/investor-information/investorinfo.htm
Click Here for Home
FAQs
What is Intrinsic Value?
Ans: When someone invests in an asset, he does so in order to earn money from the business. The investor gets paid over a period of time as long as he is invested in the asset. Now intrinsic value is the present value of all such future cash flows generated by the asset. So logically one should not invest in any asset if the ask price is more than the intrinsic value of the asset.
How is Intrinsic Value of a company calculated?
Ans: For calculating the intrinsic value of a company all its future cash flows are extrapolated based on the past performance of the company, assumptions about the future growth of the company and its terminal value. Once all these are calculated these are brought to the present date based on appropriate discounting rate. The sum of all these gives the intrinsic value of the company. It may be more or less than the market capitalization of the company. If it is more than the market capitalization of the company then the company is said to be undervalued and is a good bet as a long-term investment and vice versa.
How is Intrinsic Value of a share calculated?
Ans: Once intrinsic value of a company is calculated as explained above, it is divided by the total number of outstanding shares of the company. This gives the intrinsic value of a share.
What is Discounted Cash Flow?
Ans: When we have cash flows that are spread over a period of time then Discounted Cash Flow method is used to calculate present value of all such cash flows. The present value depends on the discounting rate used. Usually 10 year Government bond yield rate(risk free rate of return) is used as the discounting rate.
