")
")
")
")
")
")
")
")
")
")

Fundamental Analysis and Intrinsic Value of EID Parry(India) Ltd. (2023-24)
In this article we will try to analyze EID Parry(India) Ltd. based on previous six years of financial statements viz Balance sheet, Profit and Loss statement and Cash flow statement. With this fundamental analysis we will try to gain insight into the business activities, financial health, operating efficiency and profitability of the company and finally try to derive the intrinsic value of the stock using Discounted Cash Flow method and the price at which the stock becomes attractive for long term investment. This article is divided in three sections as listed below :-
Section 1: Qualitative Fundamental Analysis comprising of General Introduction, Business overview dwelling into Business Model, Strengths and Weakness, Long Term Sustainability and finally the competitors.
Section 2:Quantitative Fundamental Analysis on Financial Health, Operating Efficiency And Profitability.
Section 3: Calculation Of Intrinsic Value.
General Introduction
Dated: 26 Jan 24
Company: EID Parry(India) Ltd.
CMP: Rs. 616.65
Market Capitalisation: Rs. 10,946.62 Cr.
Share Holding Pattern:

Promoters: Murugappa Group
Top Five Competitors: Sh. Renuka Sugar, Balrampur Chini, Triveni Engineering Industries, FACT, Chambal Fertilizer
Fundamental Analysis Of EID Parry(India) Ltd.
General Introduction:
Established in 1788 the company has many firsts in the country from being the first sugar manufacturer in 1842, to setting up the first distillery in 1843, first sugar manufacturer to initiate farmer centric model in 1845, to first to promote fertilizer industry in Bharat in 1953 etc. The company along with Chevron Chemical Company and International Minerals and Chemicals Corporation of US set up Coromandel Fertilizers Ltd. in 1961. In 1981 Murugappa group of Bharat acquired majority stake in EID Parry. Some of the renowned companies under the group are Cholamandalam Investment and Finance Company Ltd., Carborundum Universal Ltd. and Tube Investments of India Ltd. (TI Cycles also known for BSA and Hercules cycles).
Business Overview:
The company’s revenue streams are derived from two primary verticals:
a) Sugar and related products
b) Fertilizers and Crop Protection
The subsidiary, Coromandel International Ltd., manages the fertilizer and crop protection segment, in which the company holds a substantial 56% stake. This division significantly contributes, amounting to approximately 79.55% of the total company revenues.
The Sugar segment of the company is currently undergoing significant transformations as it moves away from its identity as a sugar commodity manufacturer. Previously reliant on government policies, from sugarcane pricing to sales volume, where opportunities for improvement were limited, the company is now steering towards a value-addition trajectory. It aims to transition from a sugar-centric entity to a sweetener and bio-fuels enterprise, transforming from a commodity-driven to a consumer-facing organization. By integrating bioenergy, food, and nutrition, the company is strategically positioned to capitalize on the modernization trends in Bharat.
To reduce business risk, the company has re-segmented its sugar business, diminishing dependence on trade and placing a greater focus on value-added institutional spaces and consumer-facing retail markets.
E.I.D Parry, with its strong product customization expertise, stringent quality systems, and global certification standards, stands as the preferred supplier to major institutional customers. Approximately 44% of total sales come from institutional customers in pharmaceuticals, soft drinks, beverages, food, confectionery, dairy, biscuits, and ice cream. To foster growth, the company emphasizes product differentiation and value addition in the institutional segment.
The company brands its sugar as Parry’s White Label, Parry’s Refined Pure, and Amrit, catering to various retail segments. Amrit, the company’s 100% pure cane sugar, with 10 times more nutrients than regular sugar, addresses consumer demands for healthier sugar options. To meet evolving consumer needs and health awareness, the company is developing products like sulfur-free refined sugar, brown sugar, low glycemic index sugar, pharmaceutical sugar, and fortified sugar.
In alignment with its growth strategy, the company has introduced new initiatives to expand its presence in niche and innovative products for the health and wellness space. EID Parry is globally unique in producing three micro-algae at scale (Spirulina, Astaxanthin, and Chlorella), holding major certifications and serving as a leading supplier to global health supplement brands across North America, Europe, and South East Asia.
Additionally, the Government of Bharat actively pursues its biofuels program to reduce crude dependence, lower city emissions, and promote revenue growth in the agri-industry. The government’s directives on ethanol blending and financial assistance for ethanol production capacity enhancement align with the company’s focus on diversification.
The distillery segment produces alcohol from molasses, a by-product of sugar, supplied to IMFL units for liquor production.
The primary risk faced by the company is the regulated input cost of sugarcane, determined by the government to provide a minimum sale price to sugarcane farmers. The lack of correlation between sugar prices and sugarcane prices further complicates the situation. Sugarcane prices in Bharat are almost 50% higher than elsewhere.
The cyclicality of sugar production poses another risk, but the company mitigates this by focusing on value-added products from sugar production by-products. Bagasse, for instance, is repurposed as fuel pellets and raw material in the paper industry. The company explores other value additions to convert Sugar, Distillery, and Nutra by-products into products suitable for Aquaculture, Poultry, Animal Husbandry, and farming.
To support sugar mills, the government caps the quantity of sugar these mills can sell, and the Sugar Price Control mechanism stabilizes sugar prices.
Revenue generation:
| 2019 | 2021 | 2023 | |
| Fertilizers | 44.73% | 41.38% | 31.44% |
| Crop Protection | 10.78% | 11.11% | 7.42% |
| Sugar | 16.42% | 19.64% | 12.81% |
| Cogeneration | 0.75% | 0.76% | 0.71% |
| Distillery | 1.90% | 1.93% | 1.82% |
| Nutraceuticals | 1.27% | 1.36% | 0.73% |
| Govt. Subsidies | 18.59% | 17.72% | 40.81% |
| Others | 5.55% | 6.11% | 4.26% |
Standalone revenue:
| 2019 | 2021 | 2023 | |
| Sugar | 75.08% | 74.13% | 69.95% |
| Cogeneration | 3.92% | 4.46% | 5.89% |
| Distillery | 17.86% | 17.86% | 22.26% |
| Nutraceuticals | 3.85% | 3.54% | 1.90% |
Both sectors in which the company operates, namely fertilizers, crop protection, and food and fuel, are anticipated to grow in the future. With a proactive approach to challenges, the company is well-positioned to sustain its upward trajectory.
****************************************************
Financial Ratios
Leverage Ratios


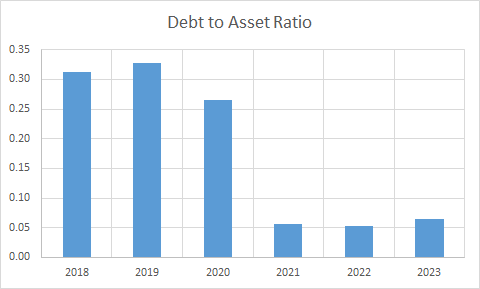
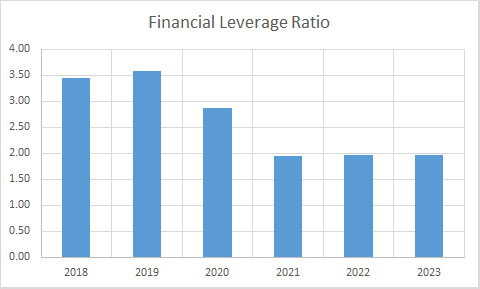
Observations:
- The company has managed to bring down debt to great extent. In absolute terms the debt has reduced to a quarter while revenue has doubled.
- Interest coverage ratio has improved. As of year 2023 the bank balances and cash and cash equivalent is more than the financing cost of the company.
Operating Ratios
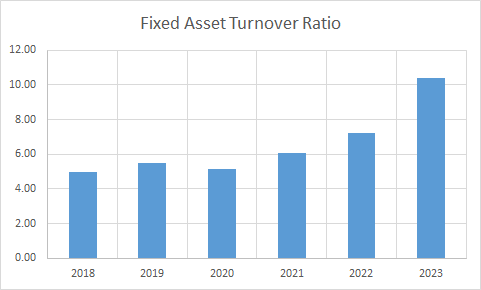


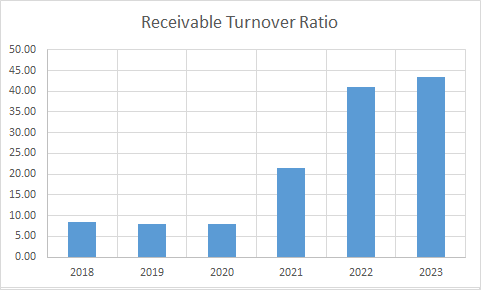
Observations:
- The company is operating with a positive working capital.
- The receivable turnover ratio has improved during the period.
Profitability Ratios

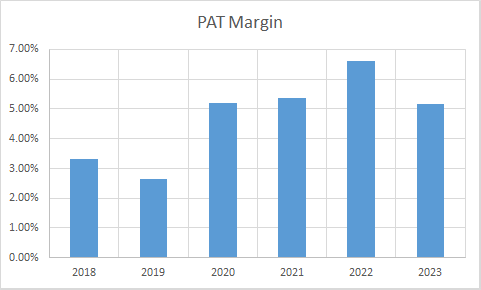


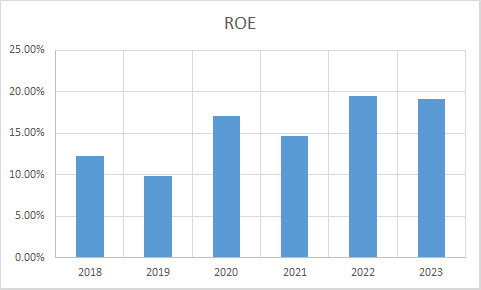
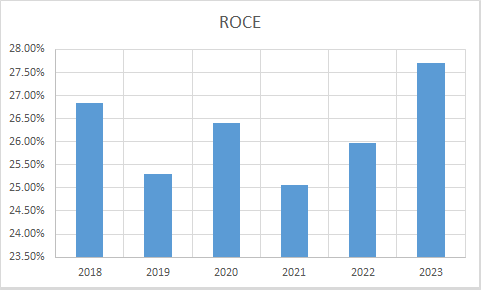
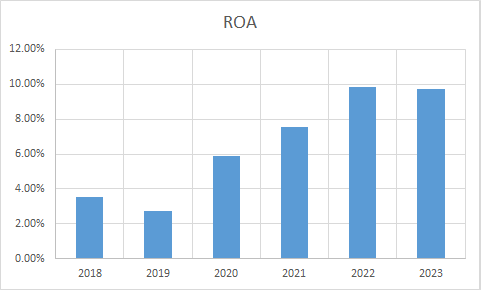
Observations:
- PAT and PAT Margins have improved during the period. This is because of the continued impetus by the company on branding and differentiating its products along with various value addition initiatives.
- Operating profit has improved while maintaining the margins.
- The company has an impressive return on capital employed and it has managed to maintain the same.
****************************************************
Intrinsic Value of EID Parry(India) Ltd.
Before we enter into the calculation of Intrinsic value of EID Parry(India) Ltd. we have to make some logical assumptions based on the previous six years financial statements and ongoing yield for 30y Government Of India bonds.
Assumptions:
- Terminal growth rate is assumed to be 0%.
- Weighted Average Cost of Capital(WACC) is assumed to be 12%.
- Free cash flow will be 7% of revenues in future. The FCF/Revenue ratio for the period under consideration has an average of 0.07. We assume that this ratio will hold good for future.
Based on the above assumptions we have arrived at two levels as intrinsic value of the firm. One is based on extrapolation of Free Cash Flow and the other is based on Free cash flows derived from extrapolated values of revenues. Both the methods only differ in how the input values are derived; in both the cases the present value is arrived at using Discounted Cash Flow Method.
Free Cash Flow Growth Model
Company Valuation: 7,58,604.26 Lakhs
Total Outstanding Shares: 17,75,17,591
Intrinsic Value: Rs. 427.34
Stock Entry price with 25% margin of safety: Rs. 320.51
Revenue Growth Model
Company Valuation: 22,33,402.25 Lakhs
Total Outstanding Shares: 17,75,17,591
Intrinsic Value: Rs. 1258.13
Stock Entry price with 25% margin of safety: Rs. 943.60
The intrinsic values arrived above are not the same since the Free Cash Flow model considers a pessimistic starting base value of present free cash flow for extrapolation whereas the Revenue Growth model takes the actual point on the extrapolation line for the current year. The average of the above two stock entry prices works out to be Rs. 632.05 (For the given number of outstanding shares). When the stock starts trading below this price it becomes attractive for long term investment. This value is valid till the next financial year results are published or some major fundamental change takes place in the company.
****************************************************
Author
Jibu Dharmapalan
Fundamental Analyst
Disclaimer:
This article is for educational purpose only. Investment in securities market is subject to market risks. Please consult your Financial Advisor before investing.
If You Like This Content 👇👇👇
Click Here To Join Us on Facebook For Free Live Interactive Discussion And Learning
References:
BSE India – EID Parry Annual Reports
EID Parry – Investors – Annual Reports
Click Here for Home
FAQs
What is Intrinsic Value?
Ans: When someone invests in an asset, he does so in order to earn money from the business. The investor gets paid over a period of time as long as he is invested in the asset. Now intrinsic value is the present value of all such future cash flows generated by the asset. So logically one should not invest in any asset if the ask price is more than the intrinsic value of the asset.
How is Intrinsic Value of a company calculated?
Ans: For calculating the intrinsic value of a company all its future cash flows are extrapolated based on the past performance of the company, assumptions about the future growth of the company and its terminal value. Once all these are calculated these are brought to the present date based on appropriate discounting rate. The sum of all these gives the intrinsic value of the company. It may be more or less than the market capitalization of the company. If it is more than the market capitalization of the company then the company is said to be undervalued and is a good bet as a long-term investment and vice versa.
How is Intrinsic Value of a share calculated?
Ans: Once intrinsic value of a company is calculated as explained above, it is divided by the total number of outstanding shares of the company. This gives the intrinsic value of a share.
What is Discounted Cash Flow?
Ans: When we have cash flows that are spread over a period of time then Discounted Cash Flow method is used to calculate present value of all such cash flows. The present value depends on the discounting rate used. Usually 10 year Government bond yield rate(risk free rate of return) is used as the discounting rate.


")
")
")
")
")
")