")
")
")
")
")
")
")
")
")
")

Fundamental Analysis and Intrinsic Value of Deepak Fertilizers And Petochemicals Corporation Ltd.(2023-24)
In this article we will try to analyze Deepak Fertilizers And Petochemicals Corporation Ltd. based on previous six years of financial statements viz Balance sheet, Profit and Loss statement and Cash flow statement. With this fundamental analysis we will try to gain insight into the business activities, financial health, operating efficiency and profitability of the company and finally try to derive the intrinsic value of the stock using Discounted Cash Flow method and the price at which the stock becomes attractive for long term investment. This article is divided in three sections as listed below :-
Section 1: Qualitative Fundamental Analysis comprising of General Introduction, Business overview dwelling into Business Model, Strengths and Weakness, Long Term Sustainability and finally the competitors.
Section 2:Quantitative Fundamental Analysis on Financial Health, Operating Efficiency And Profitability.
Section 3: Calculation Of Intrinsic Value.
General Introduction
Dated: 31 Jan 24
Company: Deepak Fertilizers And Petochemicals Corporation Ltd.
CMP: Rs. 620.20
Market Capitalisation: Rs. 7829.27 Cr.
Share Holding Pattern:

Promoters: Sailesh C Mehta, Chimanlal Khimchand Mehta, Parul Sailesh Mehta
Top Five Competitors: SRF, Linde India, Deepak Nitrite, Godrej Industries, Tata Chemicals
Fundamental Analysis Of Deepak Fertilizers And Petochemicals Corporation Ltd.
General Introduction:
Deepak Fertilizers and Petrochemicals Corporation Ltd. is one among Bharat’s leading producers of fertilizers and industrial chemicals. It was set up as an ammonia manufacturer in 1979. Today it is a multi-product Bhartiya conglomerate with product portfolio spanning from industrial chemicals, bulk and specialty fertilizers, farming diagnostics and solutions, technical ammonium nitrate and value-added real estate etc. The company has manufacturing facilities in Taloja-Maharashtra, Srikakulam- Andhra Pradesh, Panipat- Haryana and Dahej in Gujarat. The comp0any’s focus is to create value both by backward integration into raw materials and forward integration to bring sectoral depth into its strategies.
Business Overview:
The company generates revenue through three verticals
- Technical Ammonium Nitrate (TAN) – Produces low and high density ammonium nitrate, ammonium nitrate melt. Used in mining, infrastructure and mining.
- Industrial Chemicals – Produces nitric acid, iso propyl alcohol, methanol and carbon dioxide. (used in pharmaceuticals, nitro aromatics, paints and coatings, steel, inks, explosives, dyes, agro chemicals, cosmetics and adhesives)
- Crop Nutrition Business – produces nitro phosphate, Nitrogen-Phosphorus-Potassium (NPK) variants, water soluble fertilizers and bentonite
Revenue Mix
Revenue Mix clearly shows the emphasis given to TAN and Crop nutrition segments over the years. These are the two segments where the company is trying a face shift from a commodity manufacturer to a solution provider.
| 2019 | 2021 | 2023 | |
| Industrial Chemicals | 44.13% | 23.44% | 18.95% |
| Technical Ammonium Nitrate | 21.72% | 30.96% | 37.79% |
| Crop Nutrition | 33.71% | 45.4% | 43.08% |
| Others | 0.44% | 0.20% | 0.18% |
The company has an extensive experience base of more than 40 years in manufacturing. During this period, it has developed a strong dealer network and a loyal customer base across all markets. Additionally, the company is the is the only manufacturer of IPA and TAN Solids in Bharat and is the largest Nitric Acid producer of South East Asia. These along with its proximity to the customers gives it an edge over its competition. The gradual shift of global specialty chemical intermediates value chain from China to Bharat is boosting the prospects for the company.
The key industrial chemicals produced by the company include pharmaceuticals, nitro aromatics, paints and coatings, steel, inks, explosives, dyes, agro-chemicals, cosmetics, adhesives, health & hygiene serving industries like agriculture, mining, infrastructure, explosives and pharma.
In the fertilizer segment also, the company is looking at developing value added products. In line with this strategy the company has now developed crop specific and growth stage specific grade of fertilizers for grapes and tomato. The Company is also working on crop nutrient solutions in bulk fertilizer segment.
The government’s impetus on agriculture and infrastructure presents a valuable opportunity to the company. To capitalize these the company has already started its transformation into a value added brand based product company from a commodity manufacturer. With larger vision of becoming future ready the company has embarked on a journey of transformation and has started to shift:
- From generic to crop specific performance nutrients
- Technical ammonium nitrate products to mining solutions
- Commodity chemicals to end-use certified customized chemicals.
The company is also focusing on backward integration for producing the raw materials in-house to reduce the dependence on suppliers and overcome associated uncertainties. One of the major threats faced by the company is the volatility in prices of ammonia and natural gas and USD/INR exchange rate. The company requires about 1600 MTPD of ammonia. Present in-house production of ammonia is about 390 MTPD. It is expecting to commission additional capacity of its ammonia plant by FY 2025-26 taking its production capacity to 2000 MTPD.
In addition to the above, the company has an installed capacity of 100,000 MTPA for Methanol which is mainly used in pharmaceutical and paint industries. However, with the government’s comprehensive plan to blend 20% methanol/ethanol with petrol has given an opportunity to the company to expand its business.
The company is in the final steps of unwinding and de-merging each business into a separate corporate entity. This is to ensure that single-minded focus right from the board to the lowest level in the team to become committed to delivering the Vision and Mission of serving the specific customer segment needs.
****************************************************
Financial Ratios
Leverage Ratios
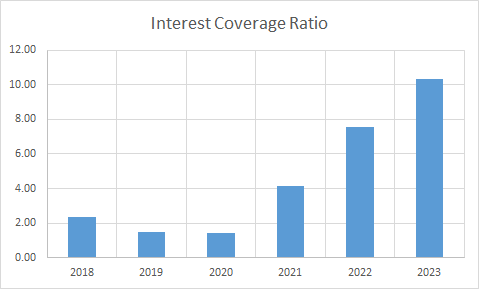
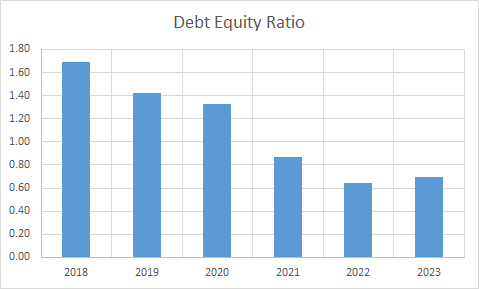
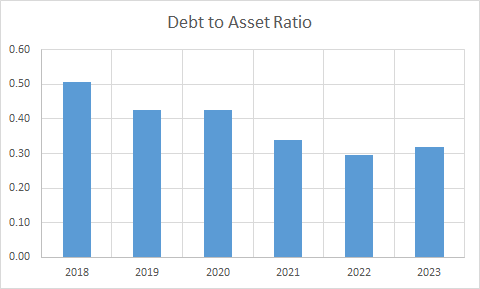
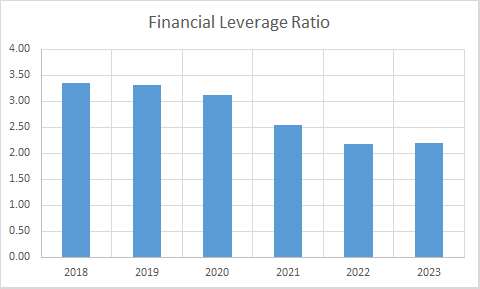
Observations:
- The company had high debt at the beginning of the period however it has reduced it during the period. Though the debt is within manageable limits, it is still on a higher side and must be brought down. The debt has not come down in absolute terms though.
- Interest coverage ratio has improved as the PAT has improved significantly during the period.
Operating Ratios
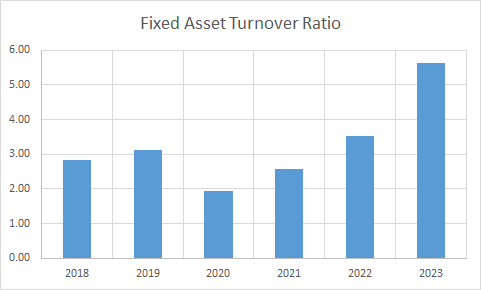


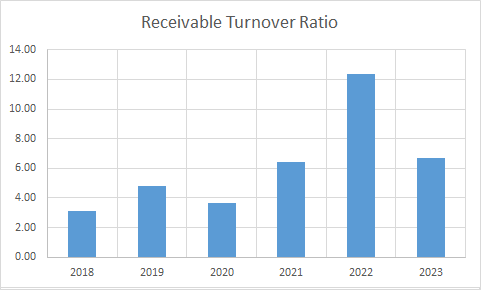
Observations:
- The company had negative working capital during the initial part however it has turned positive as the company has managed to repay most of its current debts bringing down the current liabilities.
- Receivable turnover ratio has improved during this period.
Profitability Ratios


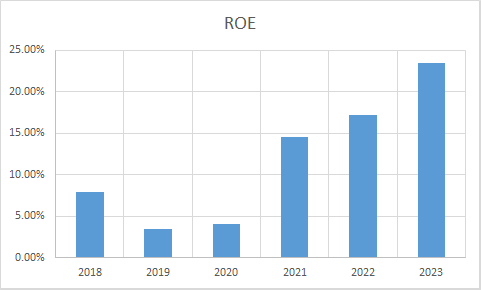

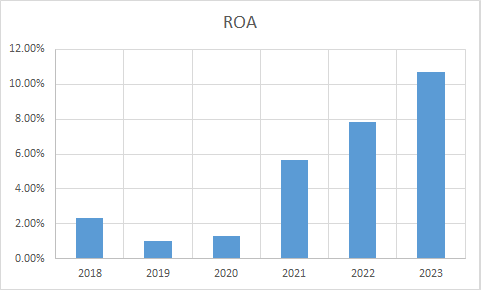
Observations:
- The company was operating with very low PAT margins, however it has improved towards year 2022 and 2023.
- Operating profits have more than quadrupled with increased margin which is a good sign.
- ROCE has steadily improved after an initial dip leading to year 2020.
****************************************************
Intrinsic Value of Deepak Fertilizers And Petochemicals Corporation Ltd.
Before we enter into the calculation of Intrinsic value of Deepak Fertilizers And Petochemicals Corporation Ltd. we have to make some logical assumptions based on the previous six years financial statements and ongoing yield for 30y Government Of India bonds.
Assumptions:
- Terminal growth rate is assumed to be 0%.
- Weighted Average Cost of Capital(WACC) is assumed to be 12%.
- Free cash flow will be 9% of revenues in future. The FCF/Revenue ratio for the period under consideration has an average of 0.09. We assume that this ratio will hold good for future.
Based on the above assumptions we have arrived at two levels as intrinsic value of the firm. One is based on extrapolation of Free Cash Flow and the other is based on Free cash flows derived from extrapolated values of revenues. Both the methods only differ in how the input values are derived; in both the cases the present value is arrived at using Discounted Cash Flow Method.
Free Cash Flow Growth Model
Company Valuation: 275,993.34 Lakhs
Total Outstanding Shares: 126,237,825
Intrinsic Value: Rs. 218.63
Stock Entry price with 25% margin of safety: Rs. 163.97
Revenue Growth Model
Company Valuation: 886,222.46 Lakhs
Total Outstanding Shares: 126,237,825
Intrinsic Value: Rs. 702.03
Stock Entry price with 25% margin of safety: Rs. 526.52
The intrinsic values arrived above are not the same since the Free Cash Flow model considers a pessimistic starting base value of present free cash flow for extrapolation whereas the Revenue Growth model takes the actual point on the extrapolation line for the current year. The average of the above two stock entry prices works out to be Rs. 345.25 (For the given number of outstanding shares). When the stock starts trading below this price it becomes attractive for long term investment. This value is valid till the next financial year results are published or some major fundamental change takes place in the company.
****************************************************
Author
Jibu Dharmapalan
Fundamental Analyst
Disclaimer:
This article is for educational purpose only. Investment in securities market is subject to market risks. Please consult your Financial Advisor before investing.
If You Like This Content 👇👇👇
Click Here To Join Us on Facebook For Free Live Interactive Discussion And Learning
References:
BSE India – Deepak Fertilizers And Petochemicals Corporation Ltd. Annual Reports
Deepak Fertilizers And Petochemicals Corporation Ltd. – Investors – Annual Reports
Click Here for Home
FAQs
What is Intrinsic Value?
Ans: When someone invests in an asset, he does so in order to earn money from the business. The investor gets paid over a period of time as long as he is invested in the asset. Now intrinsic value is the present value of all such future cash flows generated by the asset. So logically one should not invest in any asset if the ask price is more than the intrinsic value of the asset.
How is Intrinsic Value of a company calculated?
Ans: For calculating the intrinsic value of a company all its future cash flows are extrapolated based on the past performance of the company, assumptions about the future growth of the company and its terminal value. Once all these are calculated these are brought to the present date based on appropriate discounting rate. The sum of all these gives the intrinsic value of the company. It may be more or less than the market capitalization of the company. If it is more than the market capitalization of the company then the company is said to be undervalued and is a good bet as a long-term investment and vice versa.
How is Intrinsic Value of a share calculated?
Ans: Once intrinsic value of a company is calculated as explained above, it is divided by the total number of outstanding shares of the company. This gives the intrinsic value of a share.
What is Discounted Cash Flow?
Ans: When we have cash flows that are spread over a period of time then Discounted Cash Flow method is used to calculate present value of all such cash flows. The present value depends on the discounting rate used. Usually 10 year Government bond yield rate(risk free rate of return) is used as the discounting rate.

")
")
")
")
")
")