
")
")
")
")
")
")
")
")
")
")

Fundamental Analysis and Intrinsic Value of Coal India Ltd. (2023-24)
In this article we will try to analyze Coal India Ltd. based on previous six years of financial statements viz Balance sheet, Profit and Loss statement and Cash flow statement. With this fundamental analysis we will try to gain insight into the business activities, financial health, operating efficiency and profitability of the company and finally try to derive the intrinsic value of the stock using Discounted Cash Flow method and the price at which the stock becomes attractive for long term investment. This article is divided in three sections as listed below :-
Section 1: Qualitative Fundamental Analysis comprising of General Introduction, Business overview dwelling into Business Model, Strengths and Weakness, Long Term Sustainability and finally the competitors.
Section 2:Quantitative Fundamental Analysis on Financial Health, Operating Efficiency And Profitability.
Section 3: Calculation Of Intrinsic Value.
General Introduction
Dated: 03 Feb 24
Company: Coal India Ltd.
CMP: Rs. 419.55
Market Capitalisation: Rs. 258,557.27 Cr.
Share Holding Pattern:
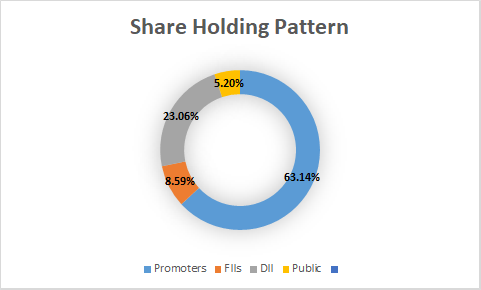
Promoters: Government of Bharat
Top Five Competitors: Singareni Collieries Company, NMDC, Tata Steel
Fundamental Analysis Of Coal India Ltd.
General Introduction:
Coal India Ltd. is a Maharatna company of Government of Bharat and was established in 1975 with a modest production 79 MTPA in its first year. Today it is one of the largest coal producers and one of the largest employers of manpower. It functions through its subsidiaries in 83 mining areas spread over eight states in the country. The company has 322 mines in total of which 138 are underground, 171 are opencast and 13 mixed mines. Apart from mines it also manages establishments like workshops, hospitals, vocational training centers etc. Though, coal remains the mainstay of the company, it is actively exploring opportunities beyond to prepare for future shift away from conventional sources of energy.
Business Overview:
Coal accounts for nearly 69% of the entire energy needs of the country and 50% of power generated in the country. Bharat remains the second largest consumer of coal accounting for about 11% of global consumption. The geological resources of coal in Bharat are in excess of approx. 360 Billion Tonnes. At the current rate of production, the reserves are adequate to meet the demand for multiple centuries to follow. Though most of the countries in the world are moving away from coal towards renewable sources of energy, in Bharat the renewable sources of energy would only supplement the role of coal as country’s primary source of energy, if not entirely substitute it. Renewables and coal have to co-exist for some time before renewable can significantly contribute to a larger share of Bharat’s energy needs.
Coal India Ltd. produces about 83% of nation’s coal output. About 81% of the company’s entire coal supply was catered to power sector. With economic development urbanization, improved electricity access, manufacturing base and rural electrification program the energy use is projected to grow at a rapid pace in coming future. As per Draft NITI Aayog Report (Nov’ 21)on “Coal Demand in India – 2030 and beyond”, demand for coal in electricity generation in Bharat will remain and gain an increasing trend in absolute terms in the near future. In percentage terms, the share of coal in energy mix is likely to reduce from current levels of 72% to 52% by 2030, 43% by 2035 and to 34% by 2040 due to high penetration of renewables in total energy mix.
Coal India Ltd.’s major consumers are Power and Steel sectors. Others include cement, fertilizer, brick, kilns etc.
The company is also investing substantial sums in diversification projects viz. Solar power, revival of fertilizer plants, acquiring coking coal assets in Australia and Canada, coal gasification etc. A joint venture company named Hindustan Urvarak & Rasayan Limited(HURL) is set up comprising of CIL, NTPC, IOCL, FCIL and HFCL with the shareholding pattern of CIL:29.67%, NTPC:29.67%, IOCL:29.67% & FCIL/HFCI combined: 10.99% to set up natural gas based 1.27MTPA urea plant. To start with, three plants are being set up in UP, Jharkhand and Bihar.
In addition there are few other ventures which the company is pursuing like
- CIL Navikarniya Urja Ltd. for exploring New and renewable sources of energy including Solar, wind, small hydro, biomass, geo-thermal, hydrogen and tidal etc.,
- CIL Solar PV Ltd. which shall undertake entire solar PV manufacturing value chain.
CIL is exploring opportunities to diversify into coal to chemical business. This is to ensure greater value addition and thereby improving financial position of the company in future.
Present Revenue mix from various customers is listed below.
| 2019 | 2021 | 2023 | |
| Power Sector | 70.06% | 67.1% | 67.5% |
| Non-Power Sector | 29.74% | 32.9% | 32.5% |
| Services | 0.2% | – | – |
Further, both Government and Private sector are still in the process of setting up thermal power stations while emphasizing the need to turn to renewables. With these stats we can comfortably assume that Coal India Ltd. will remain in relevance for at least 30 to 40 years in future.
****************************************************
Financial Ratios
Leverage Ratios
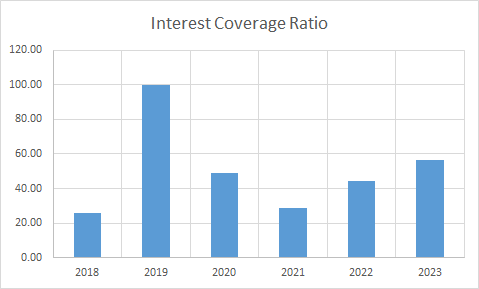
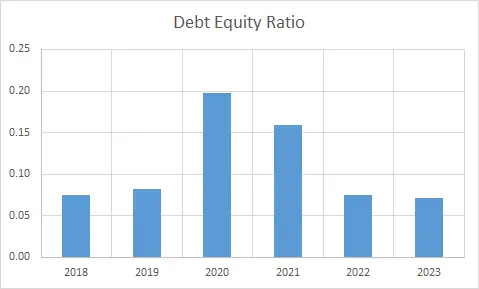
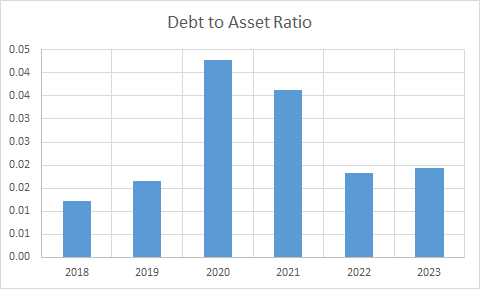
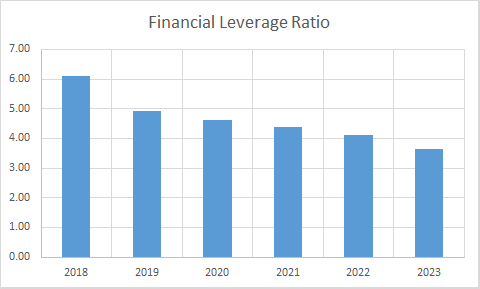
Observations:
- The company is operating with almost no debt.
- The company has maintained a good interest coverage ratio during the period.
Operating Ratios
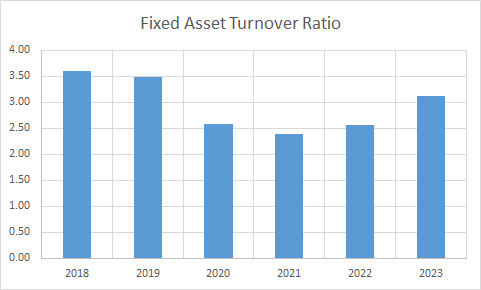
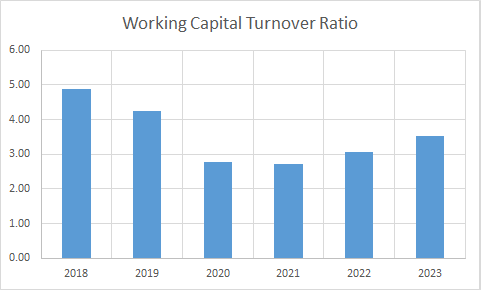
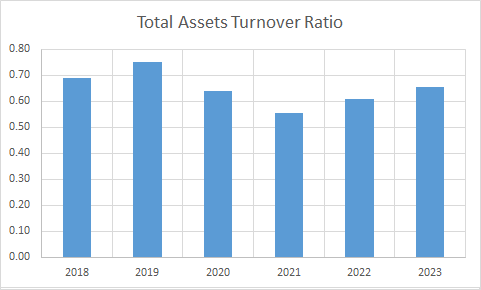
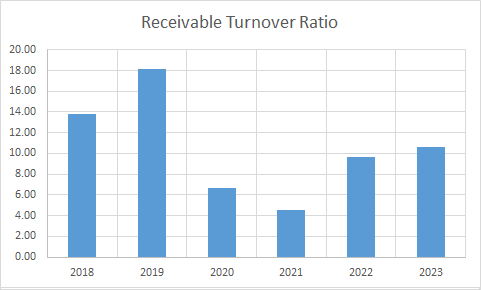
Observations:
1.Working capital turnover has remained stable during the period.
2.Receivable turnover has improved post year 2020.
Profitability Ratios
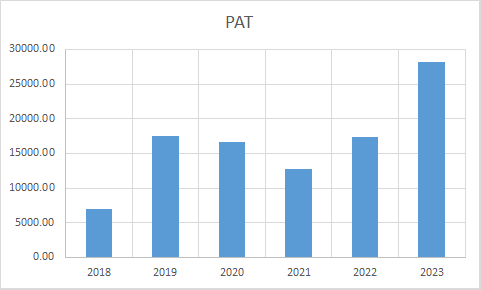
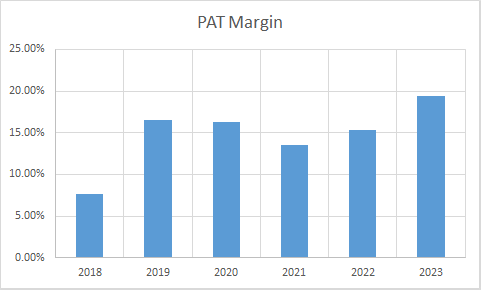
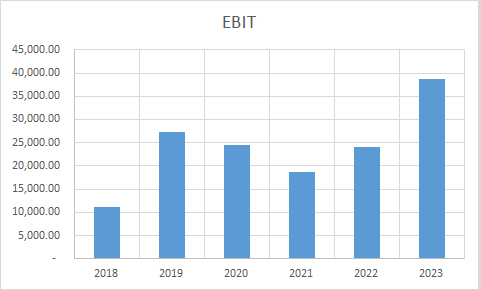
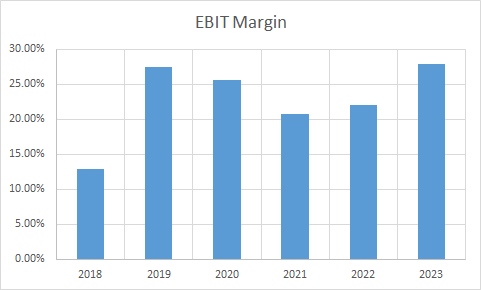
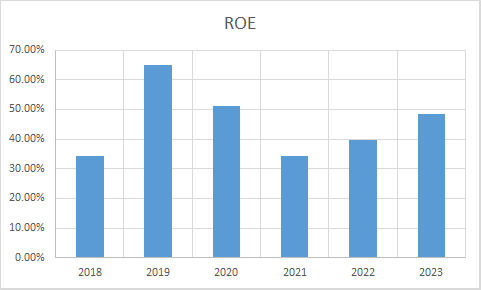
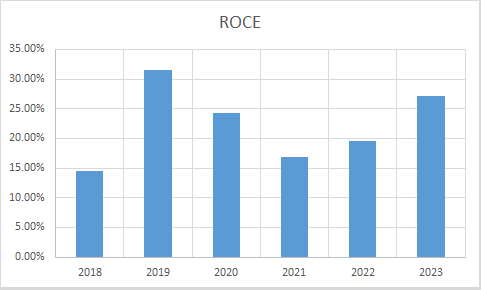
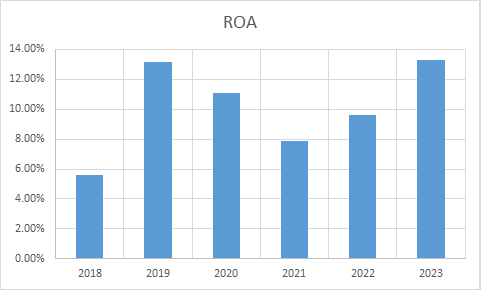
Observations:
- PAT and PAT Margins have shown improvement indicating that the company still maintains its leadership position and has considerable command over pricing of its produce.
- Other ratios ROE, ROCE and ROA have shown improvement during the period.
****************************************************
Intrinsic Value of Coal India Ltd.
Before we enter into the calculation of Intrinsic value of Coal India Ltd. we have to make some logical assumptions based on the previous ten years financial statements and ongoing yield for 30y Government Of India bonds.
Assumptions:
- Terminal growth rate is assumed to be 0%.
- Weighted Average Cost of Capital(WACC) is assumed to be 12%.
- Free cash flow will be 16% of revenues in future. The FCF/Revenue ratio for the period under consideration has an average of 0.16. We assume that this ratio will hold good for future.
Based on the above assumptions we have arrived at two levels as intrinsic value of the firm. One is based on extrapolation of Free Cash Flow and the other is based on Free cash flows derived from extrapolated values of revenues. Both the methods only differ in how the input values are derived; in both the cases the present value is arrived at using Discounted Cash Flow Method.
Free Cash Flow Growth Model
Company Valuation: 107,696.03 Crores
Total Outstanding Shares: 6,162,728,327
Intrinsic Value: Rs. 201.37
Stock Entry price with 25% margin of safety: Rs. 151.03
Revenue Growth Model
Company Valuation: 228,086.23 Crores
Total Outstanding Shares: 6,162,728,327
Intrinsic Value: Rs. 319.34
Stock Entry price with 25% margin of safety: Rs. 239.50
The intrinsic values arrived above are not the same since the Free Cash Flow model considers a pessimistic starting base value of present free cash flow for extrapolation whereas the Revenue Growth model takes the actual point on the extrapolation line for the current year. The average of the above two stock entry prices works out to be Rs. 195.27 (For the given number of outstanding shares). When the stock starts trading below this price it becomes attractive for long term investment. This value is valid till the next financial year results are published or some major fundamental change takes place in the company.
****************************************************
Author
Jibu Dharmapalan
Fundamental Analyst
Disclaimer:
This article is for educational purpose only. Investment in securities market is subject to market risks. Please consult your Financial Advisor before investing.
If You Like This Content 👇👇👇
Click Here To Join Us on Facebook For Free Live Interactive Discussion And Learning
References:
BSE India – Coal India Ltd. Annual Reports
Coal India Ltd. – Performance – Financial
Click Here for Home
FAQs
What is Intrinsic Value?
Ans: When someone invests in an asset, he does so in order to earn money from the business. The investor gets paid over a period of time as long as he is invested in the asset. Now intrinsic value is the present value of all such future cash flows generated by the asset. So logically one should not invest in any asset if the ask price is more than the intrinsic value of the asset.
How is Intrinsic Value of a company calculated?
Ans: For calculating the intrinsic value of a company all its future cash flows are extrapolated based on the past performance of the company, assumptions about the future growth of the company and its terminal value. Once all these are calculated these are brought to the present date based on appropriate discounting rate. The sum of all these gives the intrinsic value of the company. It may be more or less than the market capitalization of the company. If it is more than the market capitalization of the company then the company is said to be undervalued and is a good bet as a long-term investment and vice versa.
How is Intrinsic Value of a share calculated?
Ans: Once intrinsic value of a company is calculated as explained above, it is divided by the total number of outstanding shares of the company. This gives the intrinsic value of a share.
What is Discounted Cash Flow?
Ans: When we have cash flows that are spread over a period of time then Discounted Cash Flow method is used to calculate present value of all such cash flows. The present value depends on the discounting rate used. Usually 10 year Government bond yield rate(risk free rate of return) is used as the discounting rate.


")
")
")
")
")
")