Fundamental Analysis and Intrinsic Value of Salasar Techno Engineering Ltd. (2023-24)
In this article we will try to analyze Salasar Techno Engineering Ltd. based on previous six years of financial statements viz Balance sheet, Profit and Loss statement and Cash flow statement. With this fundamental analysis we will try to gain insight into the business activities, financial health, operating efficiency and profitability of the company and finally try to derive the intrinsic value of the stock using Discounted Cash Flow method and the price at which the stock becomes attractive for long term investment. This article is divided in three sections as listed below :-
Section 1: Qualitative Fundamental Analysis comprising of General Introduction, Business overview dwelling into Business Model, Strengths and Weakness, Long Term Sustainability and finally the competitors.
Section 2:Quantitative Fundamental Analysis on Financial Health, Operating Efficiency And Profitability.
Section 3: Calculation Of Intrinsic Value.
General Introduction
Dated: 07 Feb 24
Company: Salasar Techno Engineering Ltd.
CMP: Rs. 32.46
Market Capitalisation: Rs. 5,123.90 Cr.
Share Holding Pattern:
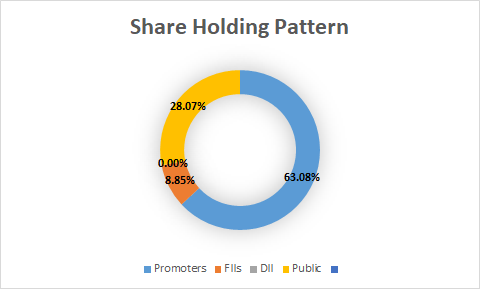
Promoters: Alok Kumar, Shalabh Agarwal, Shashank Agarwal, Tripti Agarwal
Top Five Competitors: Ratmani Metals, NMDC Steel, Welspun Corp., Maharashtra Seamless
Fundamental Analysis Of Salasar Techno Engineering Ltd.
General Introduction:
The company is primarily engaged in providing turnkey solutions from designing engineering plan to supply, erection, testing and commissioning of galvanized steel structures including telcom towers, transmission line towers, smart lighting poles, monopoles, guard rails, sub-station structures, railway electrification structures, solar panel mounting structures, heavy steel structures for railway/road bridges & ports and customized galvanized/non-galvanised steel structures. It has three manufacturing units at Jindal Nagar, Hapur District(UP) and Khera Dehat, Hapur District(UP). Since its starting in 2006 as a telecommunication tower manufacturer the company has evolved into an entity providing end to end solution for EPC projects in its field.
Business Overview:
The company started its journey with manufacturing and sale of galvanized steel structures mainly for telcom towers and soon diversified into module mounting structures for solar power plants, power transmission towers, stadium lighting towers, railway electrification towers and poles(High mast poles, smart lighting poles, monopoles and utility poles) etc. building on the skill sets possessed by the company. The company has furthered its presence into substation structures.
The rapid growth of tele density in urban space has led to the achievement of price levels where the cost benefit ratio suited large masses of population. On the supply side the service providers ensured rapid growth of the network capacity to handle the increase in the subscriber numbers ensuring that a clear business case was established for them. In order to bridge the growing digital gap between the urban and rural Bharat, it is necessary that a similar growth equation is created for rural Bharat, both for the service providers as well as for users. This potentially means setting up similar infrastructure in rural regions of the country.
The demand of electricity to support the economic growth of the country is rising continuously. This in-turn translates to the need for substantial growth in transmission sector to support the growing load and to provide connectivity to generation projects – especially the renewables. Transmission towers are an integral part of a transmission network that work as main supporting unit of overhead transmission lines used to carry high voltage power and keep them at a safe height above the ground. There is a need to install new transmission and distribution infrastructure to keep pace with trends as well as replacement of ageing infrastructure. All these factors are expected to drive the growth of transmission tower market in the country. Further the renewable sector would generate fresh potential for the transmission sector and will add to the demand of transmission towers in coming years as these projects come up in hinterland and the consumer is far from place of generation. The infrastructure that needs to be set up in terms of transmission towers, lines and substations is going to be huge.
In line with the national target of improving transport infrastructure both roads and railways, the company as entered into the business of manufacturing heavy structures for road and railway overbridges, prefabricated bridges heavy structure with an installed capacity of 1250Mt per month.
Opportunities ahead
The company is very likely to benefit from the following trends in other sectors in future:
- Increase in mobile penetration in the country.
- Increase in internet users in future.
- Improvement in rural tele density.
- Improvement in electricity demand with rural electrification, electric vehicles and rising electricity needs of urban population.
- Interstate power transmission requirements to meet the gap between power surplus and power deficit states.
- Push to set up renewable power generation stations wind, hydel and solar etc. that are mostly situated in remote locations.
- Anticipated growth in railway network and electrification of remaining existing lines.
The company does have its fair share of risks, commodity price risk being one of the most prominent one. The principal raw materials include steel and zinc. Prices and supply of these are varied due to economic conditions, competition, production levels and import duties etc. the company passes on such impacts to its clients partially or completely, by adding price escalation clause in most of the contracts.
Revenue mix of the company comprises of sale of steel structures and EPC projects. The breakdown is as given below
| 2019 | 2021 | 2023 | |
| Steel Structures | 86.59% | 68.42% | 55.25% |
| EPC Projects | 10.81% | 28.96% | 42.15% |
| Others | 2.58% | 2.62% | 2.60% |
The above revenue mix shows the evolution of the company from a mere steel structure manufacturer and supplier to an end-to-end solution provider.
****************************************************
Financial Ratios
Leverage Ratios


Observations:
- The debt equity ratio is slightly on a higher side though it has remained stable during this period.
- Interest coverage ratio has declined despite no change in debt equity ratio as the debt in absolute terms has increased during the period.
Operating Ratios


Observations:
- Despite increasing debt the company has maintained a positive working capital during the period. The working capital turnover has declined during the period indicating that the company is taking longer to realize the working capital into revenue.
- Receivable turnover has remained stable during the period.
Profitability Ratios


Observations:
- PAT has improved while PAT Margin has declined indicating expansion in market size, however the company is unable to command higher margin most probably due to competition.
- ROA, ROCE and ROE have experienced decline during the period.
****************************************************
Intrinsic Value of Salasar Techno Engineering Ltd.
Before we enter into the calculation of Intrinsic value of Salasar Techno Engineering Ltd. we have to make some logical assumptions based on the previous six years financial statements and ongoing yield for 30y Government Of India bonds.
Assumptions:
- Terminal growth rate is assumed to be 0%.
- Weighted Average Cost of Capital(WACC) is assumed to be 12%.
- Free cash flow will be 1% of revenues in future. The FCF/Revenue ratio for the period under consideration has an average of 0.01. We assume that this ratio will hold good for future.
Based on the above assumptions we have arrived at two levels as intrinsic value of the firm. One is based on extrapolation of Free Cash Flow and the other is based on Free cash flows derived from extrapolated values of revenues. Both the methods only differ in how the input values are derived; in both the cases the present value is arrived at using Discounted Cash Flow Method.
Free Cash Flow Growth Model
Company Valuation: 18,218.46 Lakhs
Total Outstanding Shares: 315,705,280
Intrinsic Value: Rs. 5.77
Stock Entry price with 25% margin of safety: Rs. 4.33
Revenue Growth Model
Company Valuation: 22,33,402.25 Lakhs
Total Outstanding Shares: 315,705,280
Intrinsic Value: Rs. 2.88
Stock Entry price with 25% margin of safety: Rs. 2.16
The intrinsic values arrived above are not the same since the Free Cash Flow model considers a pessimistic starting base value of present free cash flow for extrapolation whereas the Revenue Growth model takes the actual point on the extrapolation line for the current year. The average of the above two stock entry prices works out to be Rs. 3.24 (For the given number of outstanding shares). When the stock starts trading below this price it becomes attractive for long term investment. This value is valid till the next financial year results are published or some major fundamental change takes place in the company.
****************************************************
Author
Jibu Dharmapalan
Fundamental Analyst
Disclaimer:
This article is for educational purpose only. Investment in securities market is subject to market risks. Please consult your Financial Advisor before investing.
If You Like This Content 👇👇👇
Click Here To Join Us on Facebook For Free Live Interactive Discussion And Learning
References:
BSE India – Salasar Techno Engineering Ltd. Annual Reports
Salasar Techno Engineering Ltd. – Investors-newsroom – Annual Reports
Click Here for Home
FAQs
What is Intrinsic Value?
Ans: When someone invests in an asset, he does so in order to earn money from the business. The investor gets paid over a period of time as long as he is invested in the asset. Now intrinsic value is the present value of all such future cash flows generated by the asset. So logically one should not invest in any asset if the ask price is more than the intrinsic value of the asset.
How is Intrinsic Value of a company calculated?
Ans: For calculating the intrinsic value of a company all its future cash flows are extrapolated based on the past performance of the company, assumptions about the future growth of the company and its terminal value. Once all these are calculated these are brought to the present date based on appropriate discounting rate. The sum of all these gives the intrinsic value of the company. It may be more or less than the market capitalization of the company. If it is more than the market capitalization of the company then the company is said to be undervalued and is a good bet as a long-term investment and vice versa.
How is Intrinsic Value of a share calculated?
Ans: Once intrinsic value of a company is calculated as explained above, it is divided by the total number of outstanding shares of the company. This gives the intrinsic value of a share.
What is Discounted Cash Flow?
Ans: When we have cash flows that are spread over a period of time then Discounted Cash Flow method is used to calculate present value of all such cash flows. The present value depends on the discounting rate used. Usually 10 year Government bond yield rate(risk free rate of return) is used as the discounting rate.

