
")
")
")
")
")
")
")
")
")
")

Fundamental Analysis and Intrinsic Value of Tata Consultancy Services Ltd. (2024-25)(Modified)
In this article we will try to analyze Tata Consultancy Services Ltd. based on previous six years of financial statements viz Balance sheet, Profit and Loss statement and Cash flow statement. With this fundamental analysis we will try to gain insight into the business activities, financial health, operating efficiency and profitability of the company and finally try to derive the intrinsic value of the stock using Discounted Cash Flow method and the price at which the stock becomes attractive for long term investment. This article is divided in three sections as listed below :-
Section 1: Qualitative Fundamental Analysis comprising of General Introduction, Business overview dwelling into Business Model, Strengths and Weakness, Long Term Sustainability and finally the competitors.
Section 2: Quantitative Fundamental Analysis on Financial Health, Operating Efficiency And Profitability.
Section 3: Calculation Of Intrinsic Value.
General Introduction
Dated: 14Aug 24
Company: Tata Consultancy Services Ltd.
CMP: Rs. 4195.00
Market Capitalisation: Rs. 15,17,787.71 Cr.
Share Holding Pattern:
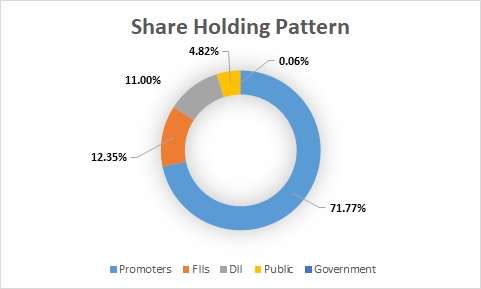
Promoters: Tata Sons
Peers: Infosys, HCL Technologies, Wipro, Tech Mahindra
Fundamental Analysis Of Tata Consultancy Services Ltd.
General Introduction:
Tata Consultancy Services Ltd. is an IT services, consulting and business solutions organization that has been partnering with many of the world’s largest businesses in their transformation journeys for over 54 years. It has a global presence, deep domain expertise in multiple industry verticals and a complete portfolio of offerings – grouped under consulting and service integration, application services, digital transformation services, cloud services, engineering services, cognitive business operations, and products and platforms –targeting every C-suite stakeholder. The company leverages all these and its deep contextual knowledge of its customers’ businesses to craft unique, high quality, high impact solutions designed to deliver differentiated business outcomes.
A part of the Tata group, India’s largest multinational business group, TCS has a large pool of the world’s best-trained consultants in 46 countries.
Business Overview:
Post pandemic the need for IT enabled services is felt more than ever before. This has led to accelerated investments in digital transformation and cloud adoption in response to changed consumer behaviors and the need for greater operational resilience. Additionally, there is increased outsourcing by enterprises looking to free up financial as well as human resources to execute their transformation programs.
The company has displayed its agility in adopting to changing market needs and aspirations of clients. Even during the onslaught of the Covid-19 pandemic the company shifted 90% of its staff to remote working model without compromising operating efficiency.
TCS works with more than 1000 organisations across the world, helping keep their systems and operations up and running. The company has launched many in house applications like Optumera, Quartz DecKit, BaNCS, Omnistore, ADD, iON etc. that can be customized to suit various client needs.
The company has been quick in recognizing the potential of new technologies and in making investments in relevant fields ahead of time in developing capabilities in terms of reskilling the workforce, research and innovation around the creative use of these technologies across different industries, building collaborative workspaces and innovation centers.
TCS’ talent acquisition strategy is to hire candidates with the right competencies required by the business at the right time, a judicious mix of lateral hires and trainees. TCS continues to remain the preferred employer at leading engineering campuses in Bharat. The company’s college recruitment efforts in USA, Canada, Latin America, China and Hungary have been progressing well with very encouraging outcomes. TCS has also been recruiting graduates from the Top 10 B-Schools in the US for key business roles.
Apart from other business risks the company faces some risks associated with the field in which it operates viz. business model challenges – due to rapidly evolving technologies and changing technology consumption patterns, Breach of data protection laws, Cyber-attacks, Intellectual Property infringement etc.
Its geographic footprint covers North America, Latin America, the United Kingdom, Continental Europe, Asia-Pacific, India, and Middle-East and Africa. The revenue breakup by geography is given below
| 2019 | 2021 | 2023 | |
| Americas | 53.0% | 51.3% | 55.2% |
| Europe | 29.7% | 31.9% | 29.9% |
| Bharat | 5.7% | 5.1% | 5.0% |
| Others | 11.6% | 11.7% | 9.9% |
The five key industry vertical clusters contributing to the revenue of the company are: Banking, Financial Services & Insurance (BFSI), Retail and Consumer Business, Communications, Media and Technology (CMT), Manufacturing and Others. The last category includes Life Sciences and Healthcare, Energy, Resources and Utilities, Public Services and others. Revenue breakup by Industry is given below:
| 2019 | 2021 | 2023 | |
| Banking Financial Services & Insurance | 39.6% | 40% | 38.2% |
| Retail & Consumer Business | 17.2% | 15.6% | 16.6% |
| Communication, Media & Technology | 16.3% | 16.5% | 16.7% |
| Manufacturing | 10.7% | 9.7% | 9.4% |
| Others | 16.2% | 18.2% | 19.1% |
Post year 2020 Life Sciences and Healthcare has emerged as one of the major contributors of revenue adding approx 10.9% in year 2023. The company has been quick in moving and capturing the opportunity right in the nick of time.
One of the key strengths of the company is the knowledge base it has created over its 55 years in service. This has helped the company in addressing a wide array or client requirements.
The company has established a strategic partnership with General Motors for global vehicle design and development including vehicle styling, EV battery, motor design and advanced virtual simulations to set new benchmarks in driving experience, safety and emissions.
Apart from process design and implementation of Passport seva kendra in Bharat and transforming India Post operations to a multi-service digital hub, the company has also partnered with govt of Bharat in rolling out the Pradhan Mantri Jan Arogya Yojana, the world’s largest fully funded insurance schemen covering 500 million of poorest in the country.
The company has focused on gaining deeper insights and develop knowledge base pertaining to each business vertical. Additionally, it has been proactive in accommodating new verticals in the natural course of evolution. The COVID-19 pandemic has tested the resilience of the company not only in keeping itself up to any task but also in providing all the necessary support in keeping the mission critical activities of its clients up and running.
The company is also evolving in the way it handles its clients. Existing customers in major markets will continue to be serviced by the same client partners, but the governance layer on top has been realigned. Instead of being governed as vertical-wise business groups, customers have now been segmented by relationship stage, and vested with three business groups: Relationship Incubation Group, Enterprise Growth Group and Business Transformation Group. These actions demonstrate that the company is continuously evolving not only in terms of technology adoption but also inward facing changes that would improve the customer interaction experience. As the company operates in the IT Sector and the field is yet to penetrate into all aspects of business and society. Further, it is a rapidly evolving sector needing frequent upgrades, requiring companies to approach IT service providers to modernize and update their existing systems. The breadth and depth of its expertise, scale, deep domain knowledge, strong partnership credentials with the hyperscalers and its portfolio of intellectual property, give the company a distinct competitive edge. This is likely to keep TCS relevant in foreseeable future.
Financial Ratios
Leverage Ratios

Observations:
- The company has no debt and has a strong interest coverage ratio.
Operating Ratios

Observations:
- Working capital turnover has improved indicating that the company is taking lesser time to convert working capital to realizable revenue.
2. Observations:
- Working capital turnover has improved indicating that the company is taking lesser time to convert working capital to realizable revenue.
- Receivable turnover has slightly declined. It can be observed that this has happened post pandemic when presumably most of the company’s clients were hit.
Profitability Ratios
Observations:
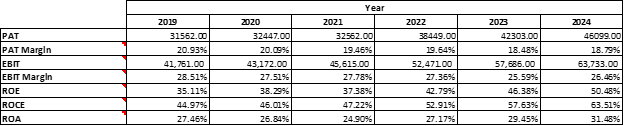
- The PAT margins have declined during this period.
- It has an impressive ROCE. However, at current Enterprise Valuations it is not attractive for a new investor as it is lesser than long term Government of India Bond Coupons.
Intrinsic Value of Tata Consultancy Services Ltd.
Before we enter into the calculation of Intrinsic value of Tata Consultancy Services Ltd. we have to make some logical assumptions based on the previous six years financial statements and ongoing yield for 30y Government of India bonds.
Assumptions:
- Terminal growth rate is assumed to be 0%.
- Weighted Average Cost of Capital(WACC) is assumed to be 12%. This is applicable when the investor is using his own capital and not relying on borrowed capital for investments.
Based on the above assumptions we have arrived at intrinsic value using on Free Cash Flows to Firm derived from extrapolated values of Revenues and Shareholder’s Equity. Further, the Revenue and Shareholder’s Equity growth are assumed to under-perform the past rate as we move further into future. Finally, in both models, the present value of all Future Free Cash Flows is arrived at using Discounted Cash Flow Method.
Revenue Growth Model
Company Valuation: Rs. 4,15,983.33 Crores
Total Outstanding Shares: 3,61,80,87,518
Intrinsic Value: Rs. 1149.73
Stock Entry price with 30% margin of safety: Rs. 804.81
Shareholder’s Equity Growth Model
Company Valuation: Rs. 5,19,919.58 Crores
Total Outstanding Shares: 3,61,80,87,518
Intrinsic Value: Rs. 1,437.00
Stock Entry price with 30% margin of safety: Rs. 1005.90 The intrinsic value of the company works out to be Rs. 905.36 (For the given number of outstanding shares). When the stock starts trading below this price it becomes attractive for long term investment. This value is valid till the next financial year results are published or some major fundamental change takes place in the company including corporate actions leading to change in number of outstanding shares.
************************************************
To learn Fundamental Analysis and Company valuation visit Intrinsic Analyst – Learning Center.
Also Check out Testimonials of people who joined us in this Investment Journey!!!
*************************************************
Author
Jibu Dharmapalan
SEBI Registered Research Analyst
Registration No. INH000014678
GSTIN: 32AHVPD3247L2Z3
Mobile: +91 9656125475
Click Here To Contact on – Whatsapp or Telegram
Check Intermediary on SEBI Website
If You Like This Content 👇👇👇
Click Here To Join Us on Facebook For Free Live Interactive Discussion And Learning
References:
BSE India – TCS Annual Reports
TCS – Investors – Annual Reports
Click Here for Home
Disclaimers
- Investment in securities market is subject to market risks. Please read all the related documents carefully before investing.
- Registration granted by SEBI and certification from NISM in no way guarantee the performance of the intermediary or provides any assurance of returns to investors.
- Past performance is not indicative of future results.
- I am SEBI Registered “Research Analyst”.
Disclosures
Standard Disclosure
1. Number of disputes/ resolved in last one year – 0/0
2. Terms and conditions on which the research report is offered – Contact on Whatsapp, Click Here
3. Whether the research analyst or research entity or his associate or his relative has any financial interest in the subject company and the nature of such financial interest. – No
4. Whether the research analyst or research entity or its associates or relatives, have actual/beneficial ownership of one percent or more securities of the subject company, at the end of the month immediately preceding the date of publication of the research report or date of the public appearance – No
5. Whether the research analyst or research entity or its associates or relatives, have actual/beneficial ownership of one percent or more securities of the subject company, at the end of the month immediately preceding the date of publication of the research report or date of the public appearance. – No
Disclosure With Regards to Compensation
6. Whether the research analyst has received any compensation from the subject company in the past twelve months. – No
7. Whether the research analyst has managed or co-managed public offering of securities for the subject company in the past twelve months. – No
8. Whether the research analyst has received any compensation for investment banking or merchant banking or brokerage services from the subject company in the past twelve months. – No
9. Whether the research analyst has received any compensation for products or services other than investment banking or merchant banking or brokerage services from the subject company in the past twelve months. – No
10. Whether the research analyst has received any compensation or other benefits from the subject company or third party in connection with the research report. – No
Disclosures With Regards To Association With The Company
11. Whether the research analyst has served as an officer, director or employee of the subject company – No
12. Has the Research Analyst acted as a manager or co-manager at any time falling within a period of forty days immediately following the day on which the securities are priced if the offering is an initial public offering. – No
13. Has the Research Analyst acted as a manager or co-manager at any time falling within a period of ten days immediately following the day on which the securities are priced if the offering is a further public offering. – No
14. Provided that research analyst is publishing or distributing research report or research analysis or making public appearance within such forty day and ten-day periods, has he received prior written approval of legal or compliance personnel as specified in the internal policies and procedures? – NA
15. A research entity who has agreed to participate or is participating as an underwriter of an issuer’s initial public offering shall not publish or distribute a research report or make public appearance regarding that issuer before expiry of twenty-five days from the date of the offering. Does the Research Analyst comply with this regulation? – Yes
16. Has the Research analyst acted as a manager or co-manager of public offering of securities of the company? – No
17. If the answer to point no. 16 is ‘yes’ then has the Research Analyst entered into expiration/waiver/termination of a lock-up agreement or any other agreement with the subject company that restricts or prohibits the sale of securities held by the subject company after the completion of public offering of securities? This includes the period fifteen days prior and fifteen days after the contractual period as per the agreement. – NA
18. Provided that research analyst is publishing or distributing research report or research analysis or making public appearance regarding that company within such fifteen days, has he obtained prior written approval of legal or compliance personnel as specified in the internal policies and procedures. – NA
19. Whether the research analyst has been engaged in market making activity for the subject company – No
FAQs
What is Intrinsic Value?
Ans: When someone invests in an asset, he does so in order to earn money from the business. The investor gets paid over a period of time as long as he is invested in the asset. Now intrinsic value is the present value of all such future cash flows generated by the asset. So logically one should not invest in any asset if the ask price is more than the intrinsic value of the asset.
How is Intrinsic Value of a company calculated?
Ans: For calculating the intrinsic value of a company all its future cash flows are extrapolated based on the past performance of the company, assumptions about the future growth of the company and its terminal value. Once all these are calculated these are brought to the present date based on appropriate discounting rate. The sum of all these gives the intrinsic value of the company. It may be more or less than the market capitalization of the company. If it is more than the market capitalization of the company then the company is said to be undervalued and is a good bet as a long-term investment and vice versa.
How is Intrinsic Value of a share calculated?
Ans: Once intrinsic value of a company is calculated as explained above, it is divided by the total number of outstanding shares of the company. This gives the intrinsic value of a share.
What is Discounted Cash Flow?
Ans: When we have cash flows that are spread over a period of time then Discounted Cash Flow method is used to calculate present value of all such cash flows. The present value depends on the discounting rate used. Usually 30 year Government bond yield rate(risk free rate of return) is used as the discounting rate.


")
")
")
")
")
")