")
")
")
")
")
")
")
")
")
")

Fundamental Analysis And Intrinsic Value of Balrampur Chini Mills Ltd.
Dated: 12 Apr 23
Company: Balrampur Chini Mills Ltd.
CMP: Rs. 412.80
Introduction
In this article we will try to analyze Balrampur Chini Mills Ltd. based on previous six years of financial statements viz Balance sheet, Profit and Loss statement and Cash flow statement. With this analysis we will try to gain insight into the financial health, operating efficiency and profitability of the company and finally try to derive the intrinsic value of the stock using Discounted Cash Flow method and the price at which the stock becomes attractive for long term investment.
Note: Here we are carrying out only the quantitative fundamental analysis of the company as the qualitative analysis is more subjective and individual views may vary vastly.
Leverage Ratios
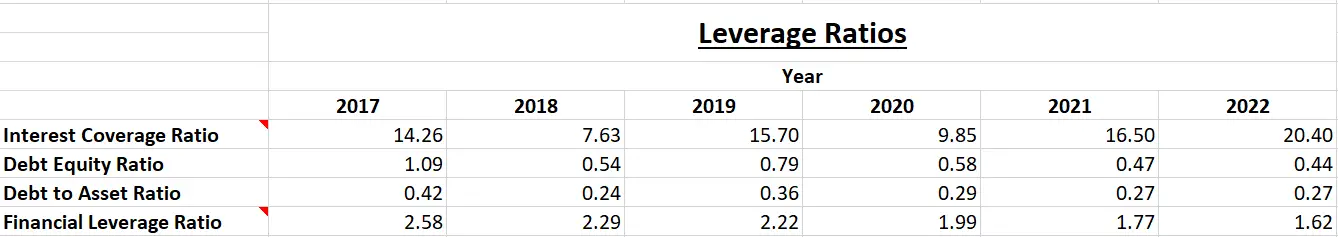
Observations:
- Company has been able to reduce its dependence on on debt.
- Company is maintaining a good interest coverage ratio.
Operating Ratios
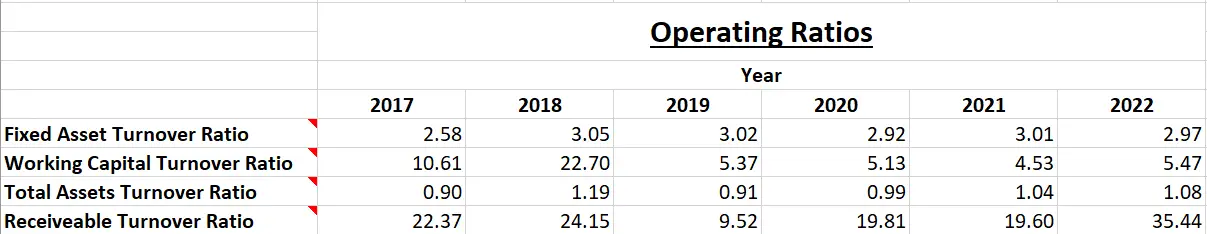
Observations:
- Working capital turnover ratio has seen a decline indicating that the revenue has not increased at the rate at which avilable working capital increased. This in turn means that the company is not able to efficiently use its current assets.
Profitability Ratios
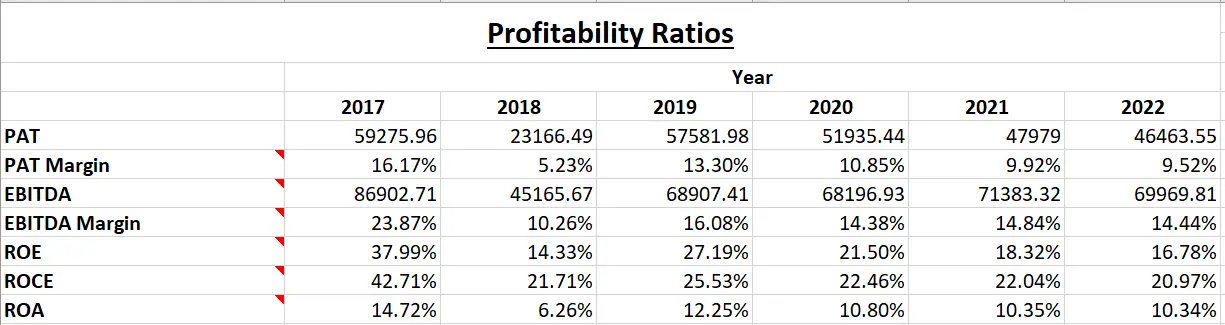
Observations:
- PAT margins have declined during the period with declining PAT. Same is the case with EBITDA and EBITDA Margins. This may indicate increasing pressure from competitors.
Intrinsic Value
Assumptions:
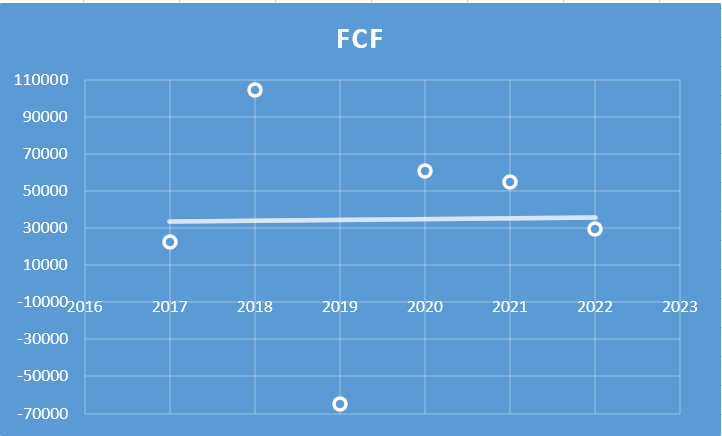
- The increase in Free Cash Flow is assumed to be Rs. 202.47 lakhs per year for the first five years and then Rs 101.24 lakhs per year from sixth to tenth year. The growth rate is projected based on the past growth of Free Cash Flow (refer to figure below). In the past Free Cash Flow has increased at the rate of Rs. 404.95 lakhs per year, however, with a conservative outlook we have taken 50% of that figure for the first five years and 25% of that for the next five years.
- Terminal growth rate is assumed to be 0%.
- Discount rate is assumed to be 12%.
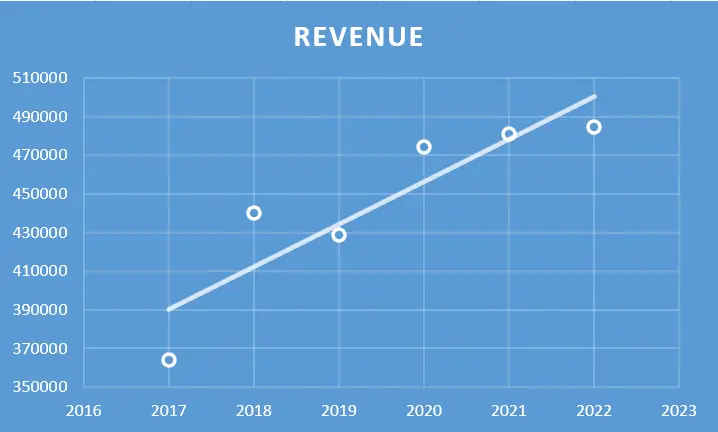
- Increase in Revenue is assumed to be Rs. 11019.25 lakhs per year for the first five years and then Rs 5509.63 lakhs per year for the next five years. This growth rate is based on analysis of previous year’s revenues (refer to figure below). In the past revenue has increased at the rate of Rs. 22038.50 lakhs per year, however, with a conservative outlook we have taken 50% of that figure for the first five years and 25% of that for the next five years.
- Free cash flow will be 8% of revenues in future. The FCF/Revenue ratio for the period under consideration has an average of 0.08. Here we assume that the same average will hold good for future.
Based on the above assumptions we have arrived at two levels as intrinsic value of the firm. One is based on extrapolation of Free cash flows and the other is based on Free cash flows derived from extrapolated values of revenues. Both the methods only differ in how the input values are derived; in both the cases the present value is arrived at using Discounted Cash Flow Method.
Free Cash Flow Growth Model
Intrinsic Value: Rs. 107.60
Stock Entry price with 25% margin of safety: Rs.80.70
Revenue Growth Model
Intrinsic Value: Rs.173.66
Stock Entry price with 25% margin of safety: Rs.130.25
The average of the above two stock entry prices works out to be Rs. 105.47. When the stock starts trading below this price it becomes attractive for long term investment.
Author
Jibu Dharmapalan
Fundamental Analyst
Disclaimer: This is not a stock advise. Investors must use their due diligence before buy/selling any stocks.
References:
More about the Company:
Board Of Directors
Click Here to go to Home Page
Click Here to go to Previous Post
Click Here to go to Next Post


")
")
")
")
")
")